Paragraphes de la section
In 2024, electricity consumption stopped falling and rose slightly, though it still remained well below pre-crisis levels
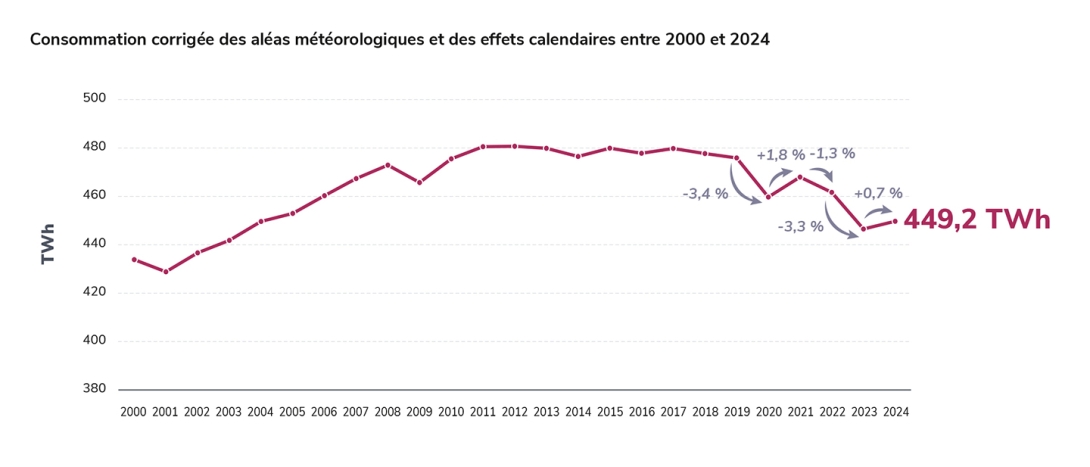
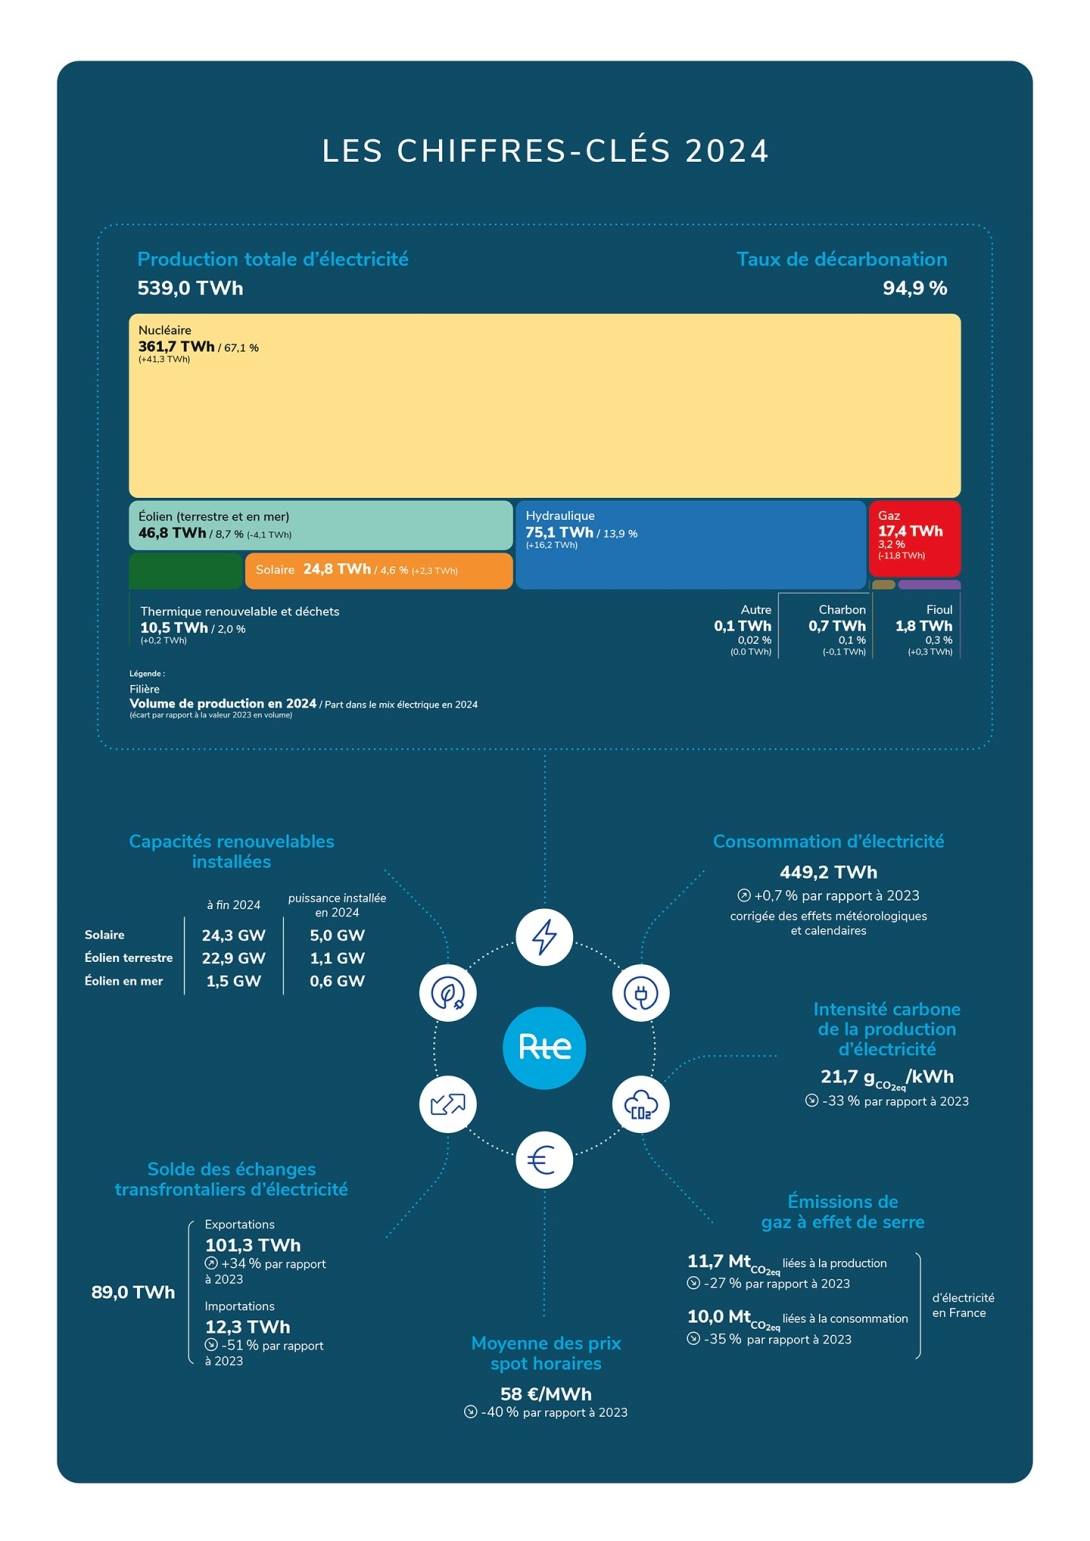
In 2024, French electricity consumption (adjusted for weather variation) amounted to 449.2 TWh.
This level represents a very slight increase (+3 TWh, or +0.7%1) compared with 2023, and a break with the downward trend seen in recent years, due to a slightly more favourable macroeconomic context.
However, it remains well below the level seen in the 2010s (around -30 TWh, or -6%, compared with average consumption over the period 2014-2019). These low levels result from the combined effects of rising electricity prices and the energy sobriety measures during the energy crisis (which are having a lasting impact), as well as continued progress in energy efficiency over the last decade.
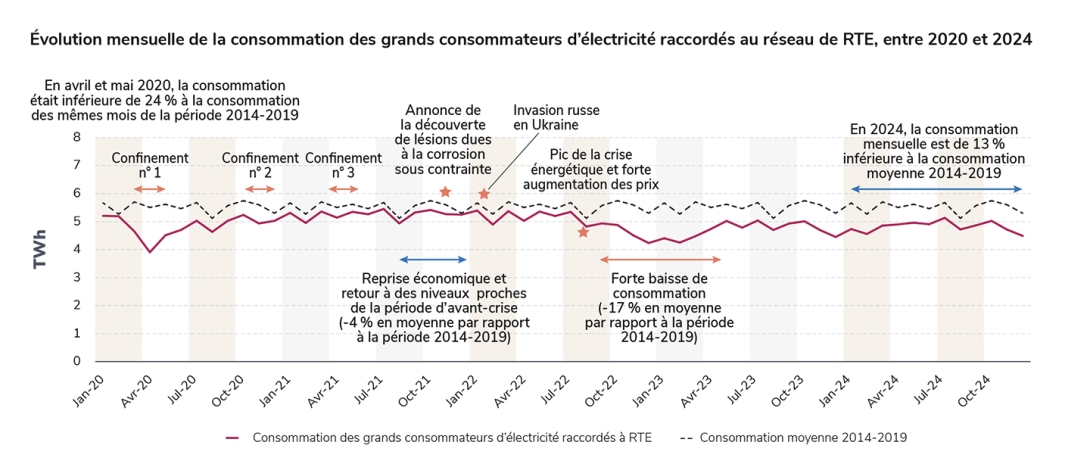
In 2024, aggregate consumption by large industrial and tertiary consumers connected to RTE’s high-and extra-high-voltage network rose by +2.4% compared with 2023, after falling for two years.
However, like the country’s overall consumption, it remains well below historical levels: -12.7% below the average for the 2014-2019 period (and -8.2% below the 2021 level).
For the first time in ten years, low-carbon generation – which was particularly abundant in 2024 – was sufficient on its own to cover 99.5% of consumption.
The low level of the consumption peaks (among the lowest for ten years) meant there was less need for thermal power stations during peak periods. For example, wind generation made a greater contribution to covering consumption during peak periods (average generation of 6.3 GW, or 9% of consumption) than thermal generation in 2024.
French electricity generation continued to grow in 2024, reaching unprecedented levels of low-carbon generation
In 2024, France returned to high levels of electricity generation and broke several records.
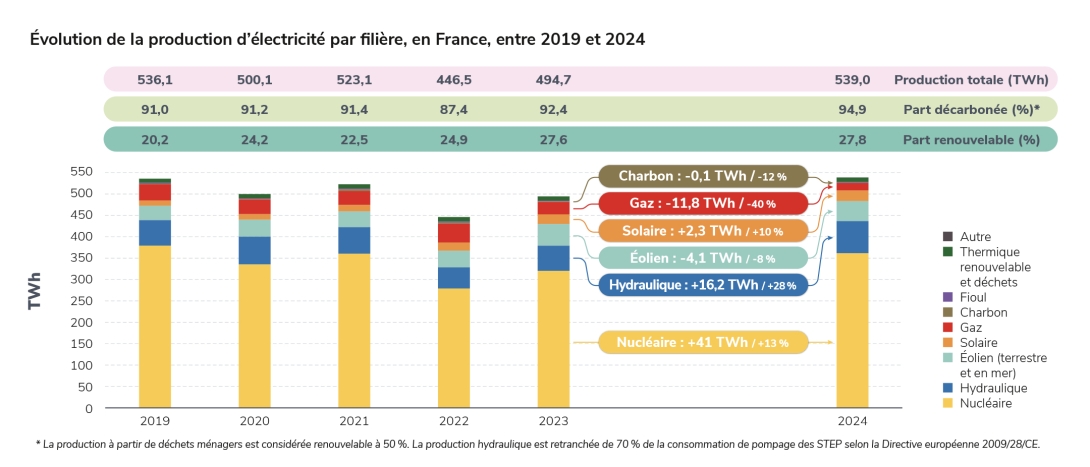
Its electricity output reached its highest level for five years (539.0 TWh). This brings it back above the 2019 level and into line with the 2014-2019 average (537.5 TWh).
This performance is the result of three factors:
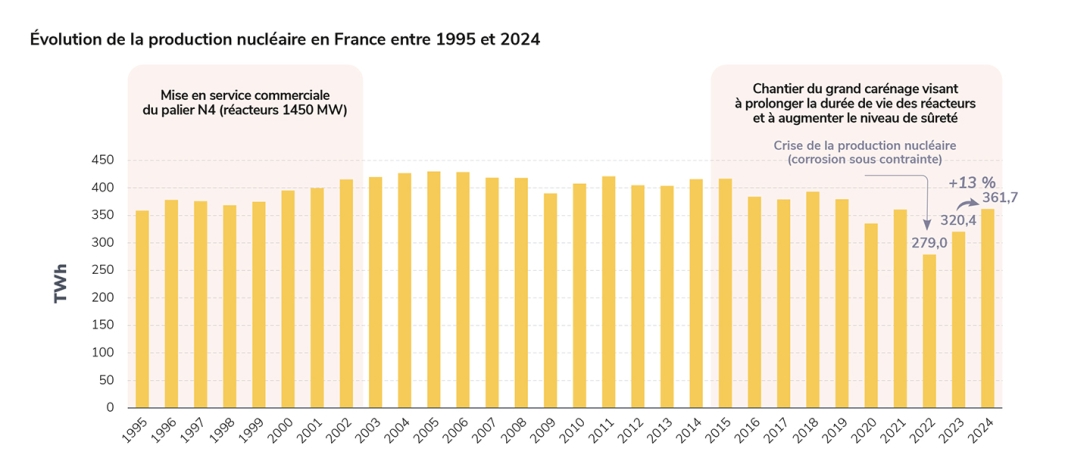
- a rapid recovery in nuclear generation (361.7 TWh), after a historically low level in 2022 (279.0 TWh) and a gradual recovery in 2023;
- exceptional hydropower generation, at its highest level since 2013 (75.1 TWh);
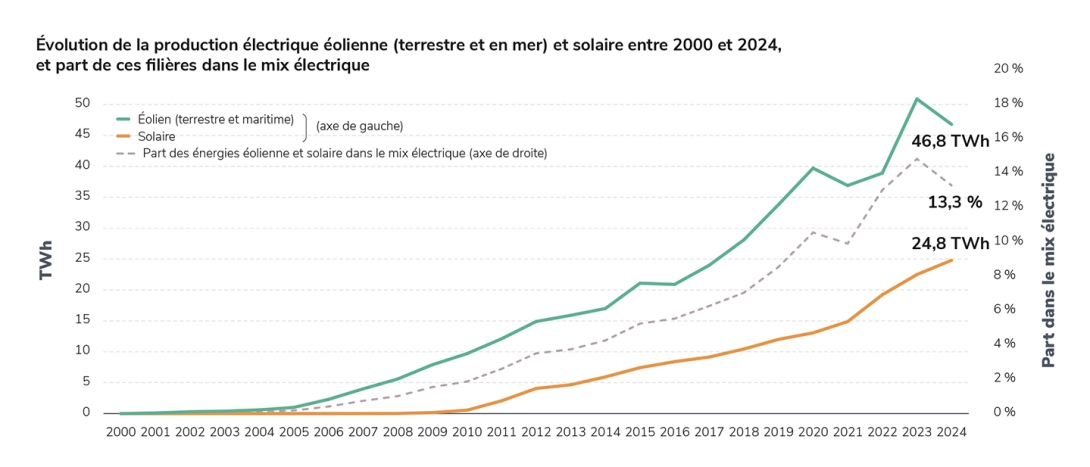
- sustained growth in wind and solar power generation (71.6 TWh in 2024, compared with 45.8 TWh in 2019).
Renewable power generation reached a record 150.0 TWh, or 27.8% of total generation.
Fossil-fired electricity generation was at its lowest level since the early 1950s (20.0 TWh), lower – for the first time – than solar power generation (24.8 TWh). Gas-fired power stations saw very little use (output of 17.4 TWh in 2024, compared with 29.2 TWh in 2023) and power generation by coal- and oil-fired power stations
(0.7 TWh and 1.8 TWh respectively) remained very low.
Low-carbon generation (nuclear and renewable) reached the threshold of 95% of the electricity generated in France for the first time. The growth in renewable power generation is essentially additive to nuclear output: they both contribute to decarbonising French and European electricity generation and increasing French exports to neighbouring countries, which reached a record level of 89 TWh.
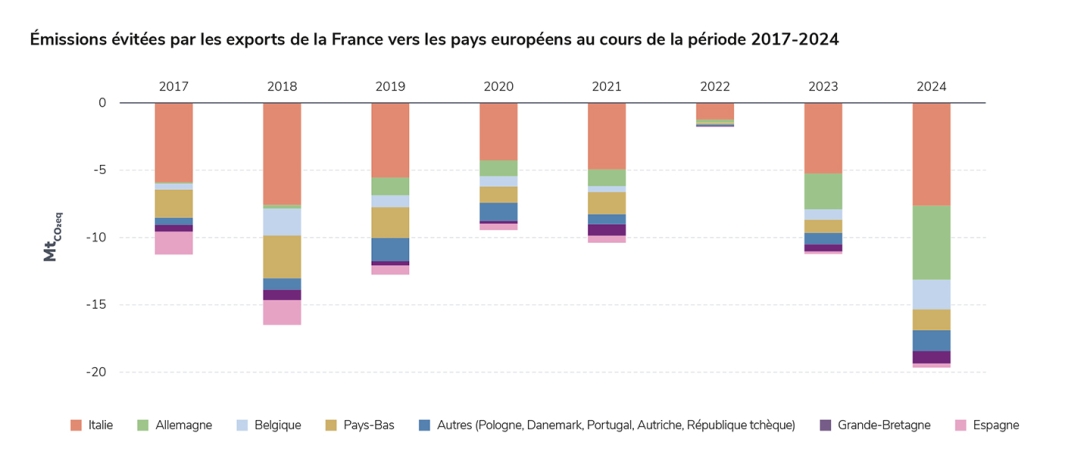
By replacing fossil-fired generation abroad, French exports have avoided emissions of 19.8 million tonnes of CO2 in other European countries.
The carbon intensity of French electricity generation was 21.7 gCO2eq/kWh, almost a third less than in 2023 and among the lowest in the world.
This performance confirms the strength of the French power system for decarbonising and reindustrialising the broader French economy (which is still almost 60% dependent on fossil fuels and imports).
France’s electricity generation capacity grew at an unprecedented rate in 2024 with the commissioning of new offshore wind farms and record growth in photovoltaic installations
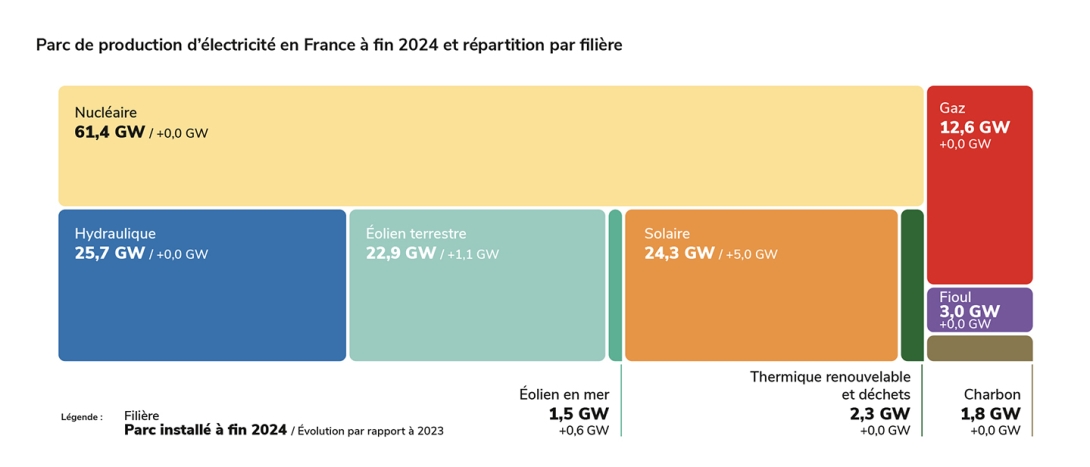
The generating fleet reached 155.5 GW of installed capacity at the end of December, an increase of 6.7 GW compared with 2023: these proportions are comparable to the growth of the French generating fleet during the construction of the nuclear plants in the early 1980s. This value does not include the new 1.6 GW nuclear reactor at the Flamanville power station, which was connected to the grid on 21 December
2024. Commissioning is scheduled for 2025, which will increase the nuclear fleet to 63 GW.
The fossil-fired and hydropower generation fleets did not change notably in 2024.
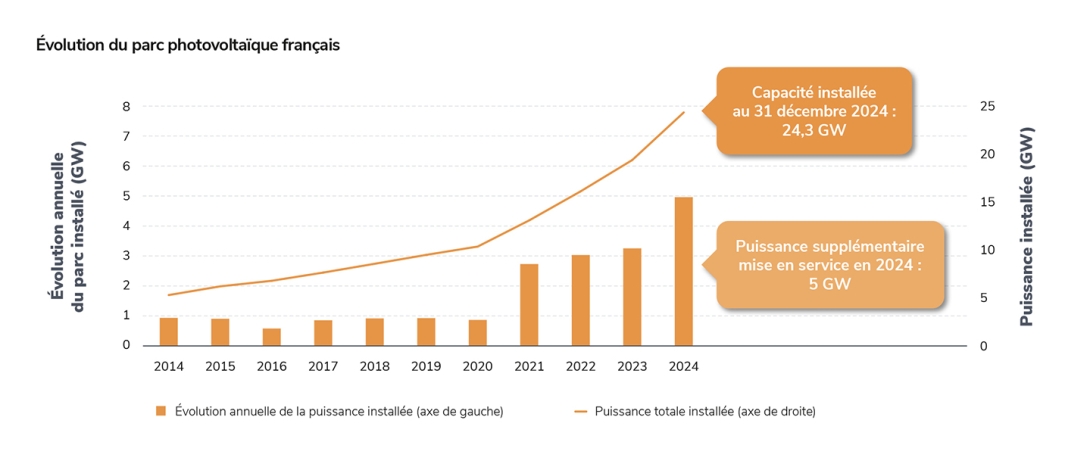
Solar power was the generating source with the highest capacity growth in France in 2024, with an increase of 5 GW, a record for the second year running (3.3 GW in 2023). This underlines the new momentum in solar growth that began in 2021 (average rate of almost 3.4 GW/year).
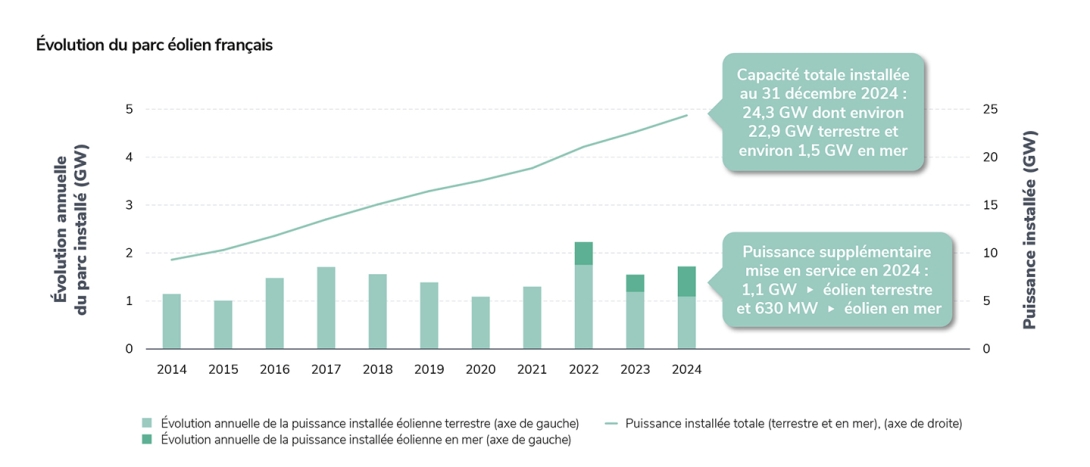
Installed photovoltaic capacity in France (24.3 GW) now exceeds that of onshore wind farms (22.9 GW), which have grown at a slightly slower rate for the second year running (+1.1 GW in 2024). In offshore wind power, the Fécamp and Saint-Brieuc wind farms (almost 500 MW each), where the first turbines started generating in 2023, were completed in 2024. Together with the Saint-Nazaire wind farm (480 MW), which came on stream in 2022, they bring offshore wind capacity to almost 1.5 GW. The wind farms at Courseulles-sur-Mer (450 MW) and the islands of Yeu and Noirmoutier (488 MW) are due to come on stream in 2025.
The development trends for solar and onshore wind power are consistent with the volumes called for in the CRE’s auctions. In particular, over the 2021-2023 period, these volumes were higher for solar power (7.5 GW in total over the period) than for onshore wind power (5.3 GW in total).
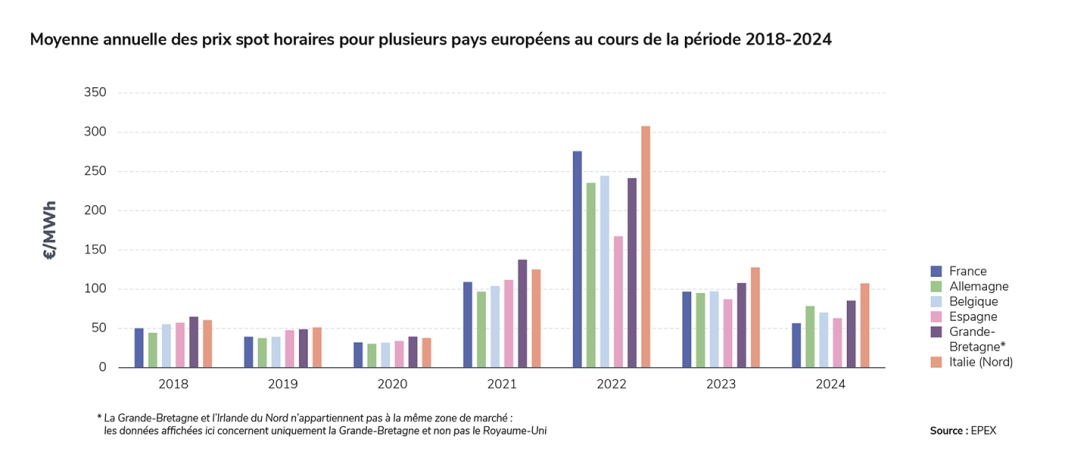
Spot electricity prices in France returned close to pre-crisis levels in 2024, continuing the fall that began in 2023
In 2024, prices on the wholesale markets continued their fall from the highs of the 2022 energy crisis:
- the French annual average spot price was €58/MWh (compared with €97/MWh in 2023 and €276/MWh in 2022). Prices have thus returned to levels similar to those seen before the pandemic and the energy crisis,
but are more volatile, with an increase in episodes of low or negative prices (see opposite); - French forward prices also fell significantly in 2024, in line with gas forward prices, but remain higher than in 2019. This decline is mainly due to the abundance of low-cost, low-carbon electricity production (in France and Europe), combined with consumption that is still lower than before the pandemic and the energy crisis, and with the fall in gas prices.
In 2024, French forward prices remained lower than in all the neighbouring countries, except Spain and Portugal, which are poorly interconnected and have mostly renewable generation.
Spot prices fell across the board in Europe, particularly in countries with mostly low-carbon power generation (e.g. France and Spain, where the low-carbon proportion is now over 75%). For the first time since 2011, the average spot price was lower in France than in Germany.
The French spot price was below the variable costs of thermal power stations 71% of the time. This is a major development compared to 2023 (when the rate was 48%), mainly due to the increase in low-carbon generation. However, this situation could change in the coming years if consumption increases.
Focus on negative prices
In a power system with a growing share of renewables, an increase in negative prices is to be expected, particularly if electricity consumption remains low.
In fact, 2024 saw twice as many negative spot prices as 2023. They accounted for only 361 hours, or 4% of the time. When they did occur, negative prices mostly remained close to zero, without reaching very low values, and often in a sequence of several hours at night or in the afternoon on spring and summer weekends.
The referenced media source is missing and needs to be re-embedded.
The factors that can reduce the emergence of these negative price episodes are clear:
- developing flexibility in terms of consumption and storage by positioning certain types of consumption, such as charging electric vehicles or switching on water heaters, in the middle of the day. This type of flexibility requires a specific economic model, enabling consumers to benefit from
being flexible (explicit load shedding, peak/off-peak supply tariffs etc.); - flexibility in the generating fleet, which depends mainly on modulating nuclear and hydro power, but with renewable energy able to play an increasing role as long as the legislative and regulatory framework generates the appropriate incentives.
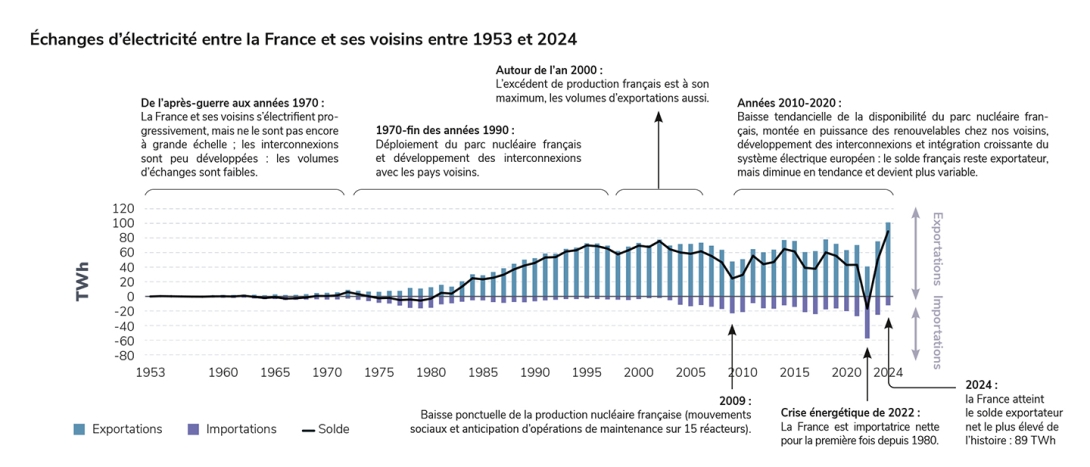
In 2024, France recorded the highest net export balance in its history
Overview of trade
In 2024, France broke two records in terms of electricity trade: on one hand, its gross electricity exports reached an all-time high (101.3 TWh); and on the other, its net trade balance exceeded the all-time record set in 2002 (76 TWh), reaching 89 TWh.
These records come just two years after 2022, when the country was a net importer for the first time since 1980.
They result from the combined effect of consumption remaining low and the recovery of French electricity generation (restoration of nuclear generation after the energy crisis, exceptional hydropower output and continued development of renewable energy).
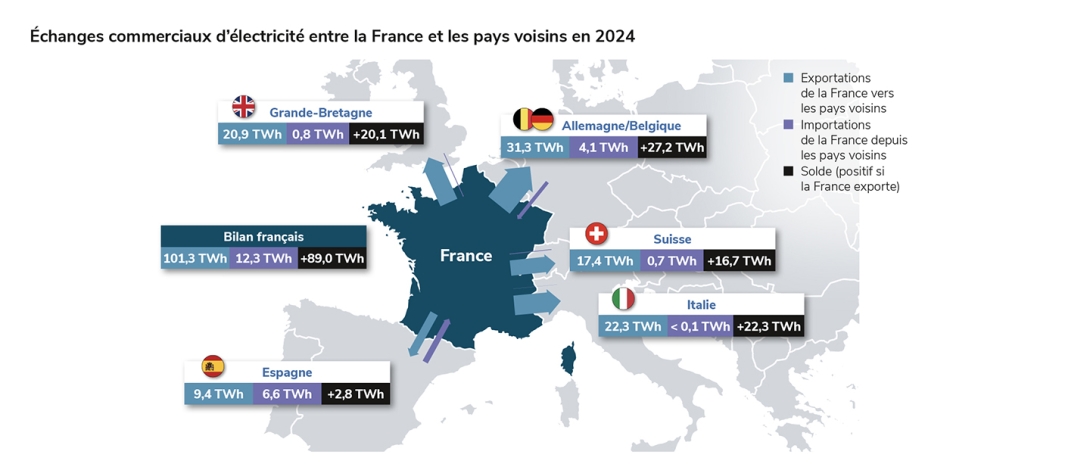
In 2024, France exported significant quantities across all its borders: Germany–Belgium (+27.2 TWh), Italy (+22.3 TWh), United Kingdom (+20.1 TWh), Switzerland (+16.7 TWh) and to a lesser extent Spain (+2.8 TWh).
Very high levels of exports were recorded every month, with slight seasonal variations (average monthly balance of 6.3 TWh from January to the end of April and in December, and 8.2 TWh between May and November, due to lower consumption during the summer). Exports were higher on working days and in the evening and at night, as solar generation in neighbouring countries reduced their need for imports during the day.
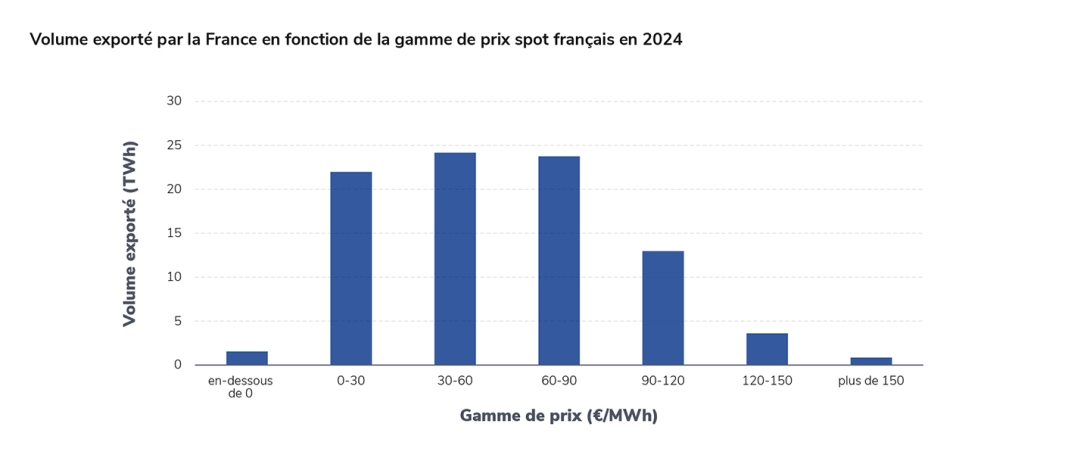
The scale of these volumes reflects the competitiveness of the French generating fleet on a European scale. Because of its low variable costs, French generation is prioritised over thermal power stations. In fact, it was exported at a very wide range of prices, both high and low, with very favourable economic consequences for the country.
France thus has an abundance of low-carbon electricity that can be used to decarbonise its economy or limit the use of coal and gas in European electricity generation, with a high degree of climatic and economic efficiency.
Detailed analysis of export and import trends
In 2024, France was a net exporter 98% of the time, exporting a total of 101.3 TWh to all its neighbours compared with 12.3 TWh of imports, mainly from Spain, Germany and Belgium). It was an exporter across all its borders a third of the time.
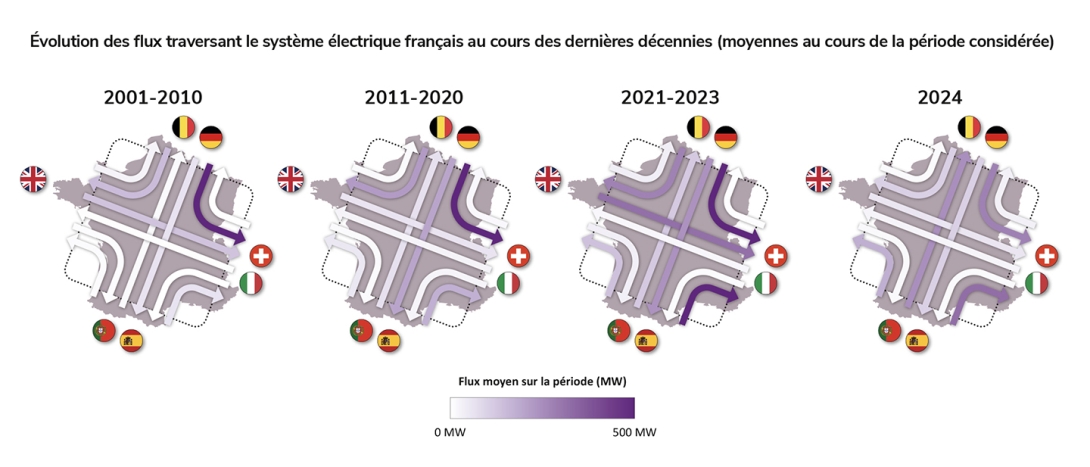
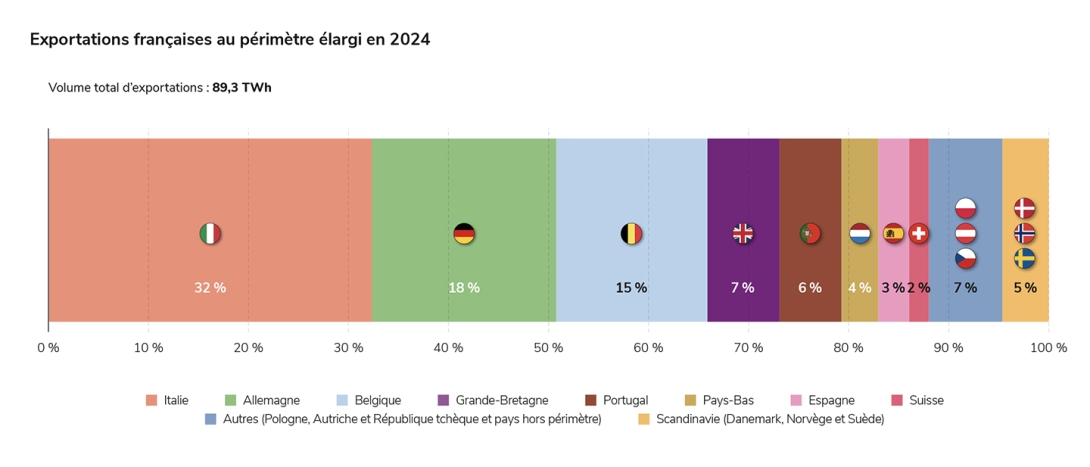
In geographical terms, 97% of imports from one of the country’s borders were simultaneously re-exported across one or more other borders: these are through flows. Due to its position as an “electricity crossroads” between its neighbours, and its many interconnections, France also plays a role as a transit country, and this is likely to continue.
The year 2024 was a further illustration of the change in flows that had already been visible since the early 2020s. While through flows mainly formed a loop linking Germany to Italy
and Switzerland between 2001 and 2020, a new pattern of flows from the Iberian peninsula to the rest of Europe has developed in recent years, reaching a comparable scale in 2024.
RTE has analysed trade by cross-referencing all the commercial flows on a European scale in order to identify the times when electricity “only” transits through a country, and to identify the countries of origin, transit and destination of the flows. Spain, Belgium and Switzerland also act as transit hubs for Portugal, Germany and the Netherlands, and Italy respectively. The analysis reveals that the leading importer from France in 2024 was Italy (32%), followed by Germany (18%), Belgium (15%), the UK and Portugal.
In economic terms, RTE has carried out a detailed analysis of export situations and the corresponding market prices, as announced when the outlook for the winter of 2024–2025 was presented. This analysis shows that France exported in all situations, whether market prices were high or low, and that it imported occasionally, particularly from areas affected by negative prices. The volumes of electricity exported by France in 2024 thus reflect the competitiveness of its generating fleet on a European scale. France did not “dump” its electricity at rock-bottom prices: the European market has provided an outlet for its competitive, low-carbon generation, which is considerably higher than its needs.
The economic impact of these exports has been very positive for the country.
In 2024, the total value of French electricity exports reached the unprecedented level of €5 billion (compared with €1 billion to €3 billion/year since 2000).
However, the contribution of electricity exports to France’s energy bill is still very small compared with the cost of importing fossil fuels for non-electrified energy uses: in 2024, fossil fuel imports cost more than €64 billion.
Greenhouse gas emissions from the French power system reached a historic minimum for the second year running in 2024
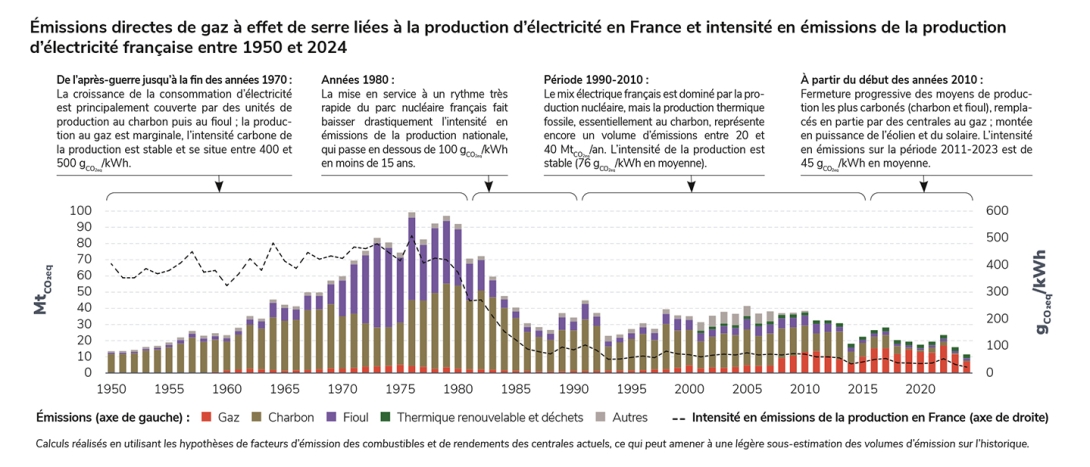
In 2024, direct emissions of greenhouse gases from electricity generation in France totalled 11.7 MtCO2eq, 30% less than in 2023 and the lowest level since the end of the Second World War.
This result was achieved thanks to a historically high rate of decarbonisation of electricity generation (95%), even though France exported record volumes of electricity and consumption picked up slightly. It results from a combination of factors: the rapid recovery of nuclear generation following the crisis that had affected the nuclear fleet in previous years; particularly high hydropower output; and abundant renewable generation as the fleet continues to expand. As a result, little use was made of fossil-fired generation (see Generation section).
Two-thirds of electricity generation emissions are due to gas-fired generation (7.1 MtCO2eq), followed by electricity generation from waste incineration (2.3 MtCO2eq) and oil-fired generation (1.4 MtCO2eq). Emissions
from coal-fired power stations in France are now negligible, as this power source is very little used: in 2024, coal-fired power stations emitted less than 0.7 MtCO2eq, representing just 5% of emissions from French electricity generation, and around one thousandth of the country’s total emissions across all sectors.
The average carbon intensity of French electricity generation reached 21.7 gCO2eq/kWh in 2024, its lowest level ever. Nearly half the time, carbon intensity was even less than 10 gCO2eq/kWh, a level corresponding to sectors that are essentially inflexible (gas-fired cogeneration, waste). Finally, emissions remained limited even during periods of high consumption: carbon intensity never exceeded 70 gCO2eq/kWh.
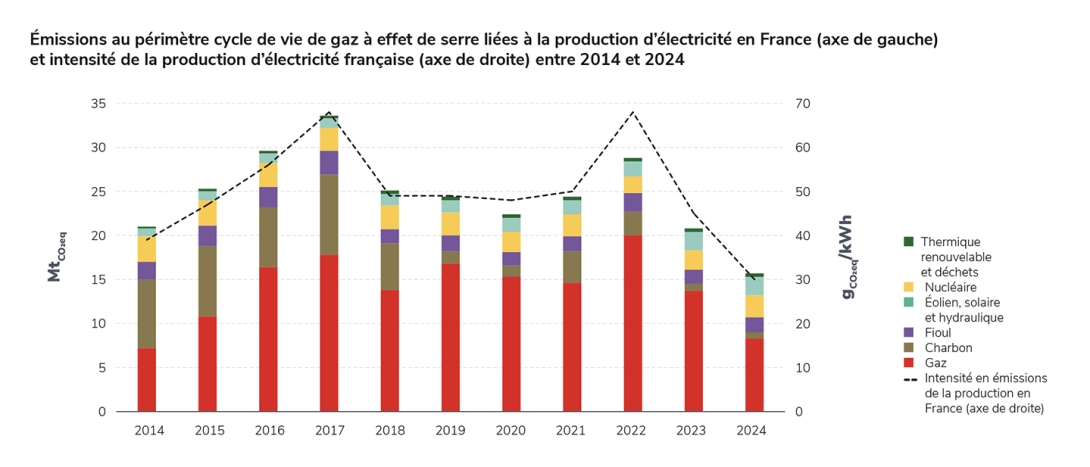
Even when life-cycle emissions are taken into account, the French power system still performs very well, with an intensity of 30.2 gCO2eq/kWh. Total life-cycle emissions from electricity generation in France amounted to 16.1 MtCO2eq in 2024.
In Europe, only Norway, which has abundant hydroelectric resources, recorded a lower carbon intensity than France in 2024 (6 gCO2eq/kWh for direct emissions).
Exports of French electricity, which reached a record level in 2024 (89 TWh, see the Trade chapter), helped to avoid emissions amounting to 19.8 MtCO2eq across Europe in 2024, i.e. more than the emissions from French generation. More than a third of the emissions avoided were in Italy, and a quarter in Germany. This record level is largely due to the volumes involved: the very high level of exports offset the effect of the gradual decarbonisation of power generation elsewhere in Europe (see the Europe chapter) – and therefore the fall in the carbon intensity differential between France and other countries.
France’s generation fleet is particularly low-carbon. The country’s priority is thus to make optimum use of this abundant low-carbon power to convert and supply energy uses that rely on fossil fuels.
In Europe, low-carbon sources are gradually replacing fossil fuels
On a European scale, electricity consumption and generation in the 27 European Union countries rose slightly in 2024 compared to 2023, ending the downward trend seen since the energy crisis began:
- Electricity consumption (non-adjusted for weather and calendar effects) rose by 1.2% in 2024 (after falling by 3.1% in 2022 and 3.2% in 2023), driven by a slightly more favourable economic context and despite the highest average temperature on record (+1.5°C compared with the pre-industrial era), which acted in the opposite direction, curbing the rise in consumption in winter.
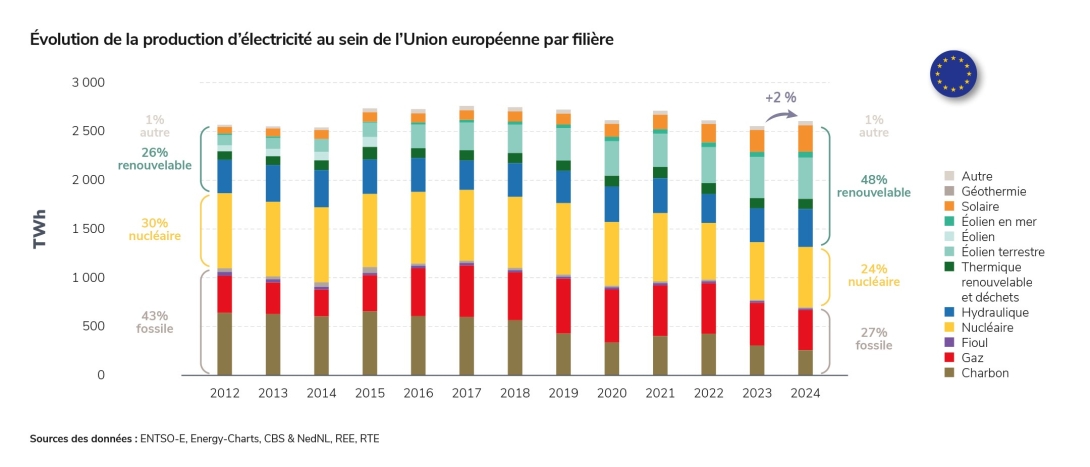
- Generation increased by 2% in 2024 compared with 2023, with fossil fuel-based output falling sharply in favour of generation from low-carbon sources.
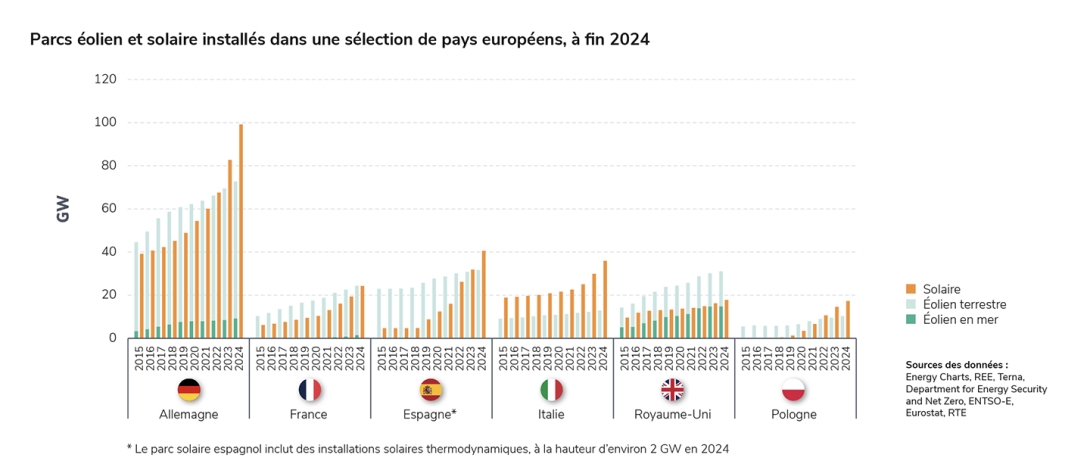
The rise in solar generation continued across Europe, with a 21% increase in 2024 compared to 2023, even more significant than the 18.9% increase in 2023 compared to 2022. For the first time, solar generation (271 TWh) exceeded coal-fired generation (258 TWh). These historic levels result from the accelerating pace of solar power development in many countries (e.g. Austria, Poland, the Netherlands, Italy): installed capacity across the European Union reached 338 GW by the end of 2024 (66 GW more than in 2023)2.
Wind power (484 TWh) was second only to nuclear (619 TWh, 58% of which was in France). As in 2023, it was higher than gas-fired generation (411 TWh in 2024). Hydropower generation was 11.7% higher than in 2023 thanks to abundant rainfall. Nuclear generation rose by 4.8%, mainly due to strong performance from the French nuclear fleet (+41 TWh), which more than offset the lower output from other European Union countries
(–12.4 TWh).
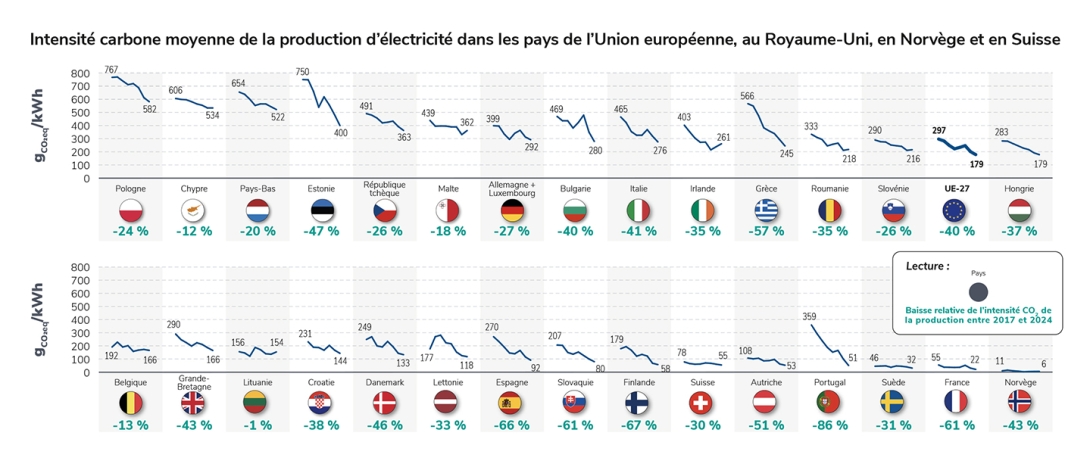
The year 2024 thus illustrates the rapid decarbonisation of European electricity mixes due to the development of renewable energy, which is gradually replacing fossil-fuel generation. Between 2017 and 2024, the average carbon intensity of electricity produced in the 27 European Union member states fell by 27%, f rom 4 57 gCO2/kWh to 334 gCO2/kWh. The countries with the greatest reductions over this period were Portugal (–89%) and Spain (–69%).
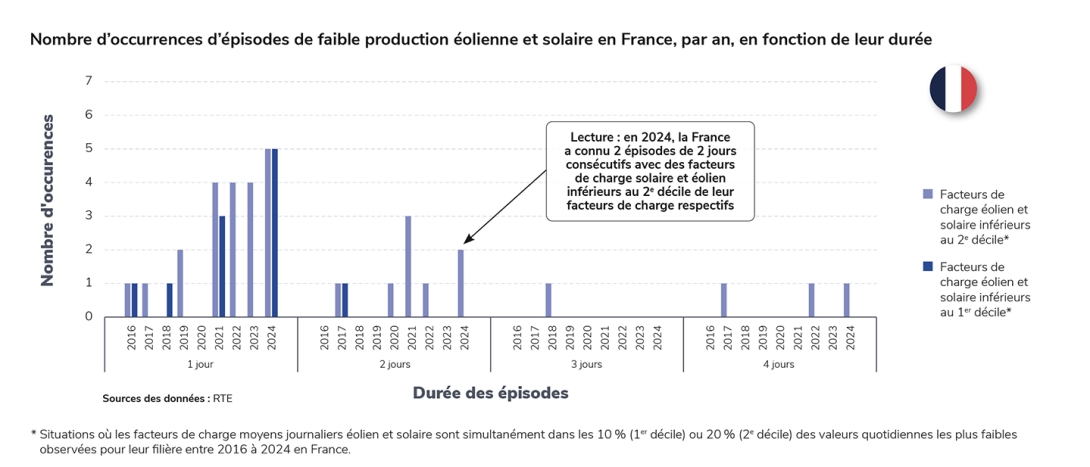
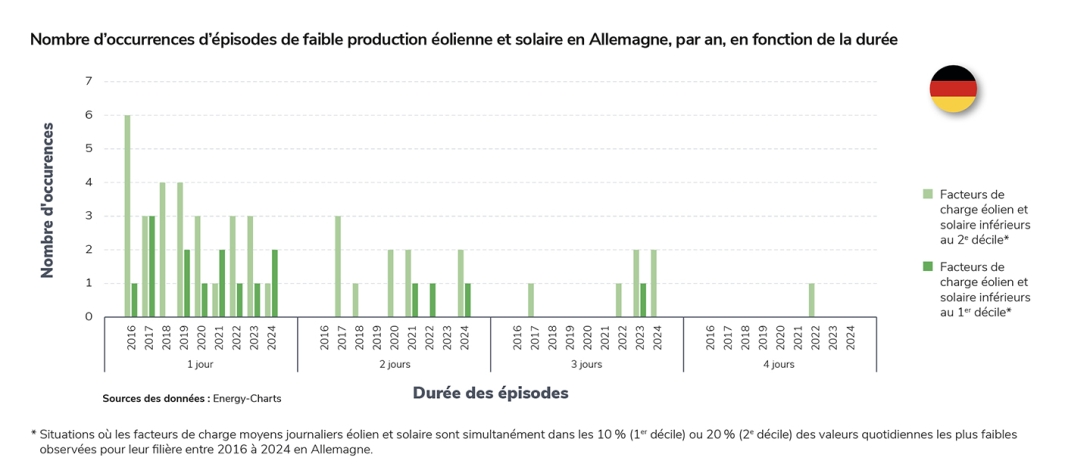
Focus on episodes of low wind and solar production
The development of renewable energy (solar and wind power) across Europe often leads to fears over security of supply when solar and wind generation is low for several consecutive days (known as “Dunkelflaute” in German).
France experienced three such episodes in 2024, including two lasting two days and one lasting four days, when the wind and solar load factors were below their second decile (in 2023 there were no episodes lasting several days – see opposite).
Germany recorded four episodes of this type over the course of the year.
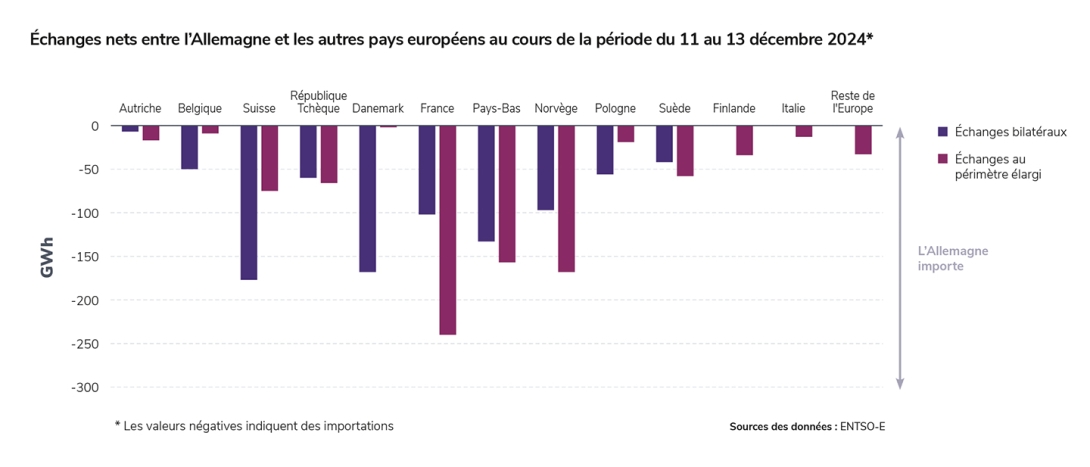
Analysis of the Dunkeflaute situation in Germany between 11 and 13 December:
On 12 December, total solar and wind power output in Germany was just 55 GWh (the lowest since 2021), compared with an average of 570 GWh/day over the course of the year, with significant consequences for the operation of the power system:
• the average daily spot price in Germany reached an annual high of €395/MWh on that day due to strong demand for gas-fired generation;
• Germany’s imports reached the highest proportion of the year (325 GWh), across all its borders, particularly from Switzerland (64 GWh), Denmark (50 GWh), the Netherlands (44 GWh) and France (37 GWh), taking bilateral commercial trade into account.
RTE’s analysis, which tracks electricity trade flows beyond direct neighbours (“extended European scope”), shows that net exports from France to Germany over this period (240 GWh in total) were much higher than bilateral exports (103 GWh in total): much of the volume exported from France to Germany passed through third countries, particularly Switzerland and Belgium. In fact, the analysis shows that the countries that exported the most to Germany during the December Dunkelflaute were France (240 GWh), Norway (168 GWh), which was able to draw on its large hydropower stocks, and the Netherlands (157 GWh).
Wind generation was also low in France during this period, leading to increased demand for nuclear, hydropower and, to a lesser extent, thermal generation. The French price rose, but by much less than the German price, reaching a daily average of €173/MWh on 12 December and €177/MWh the following day (when French wind and solar generation was even lower). These conditions did not prevent gas-fired electricity generation in France from reaching its lowest level since 2014 in 2024.
These Dunkelflaute episodes are not a new phenomenon: episodes lasting only two or three days (with wind and solar load factors below the second or even first decile) have occurred almost every year in Germany in recent years, and to a lesser extent in France.
They are an integral part of the meteorological scenarios used by RTE to assess the security of the electricity supply in different countries in its seasonal and medium-term analyses.
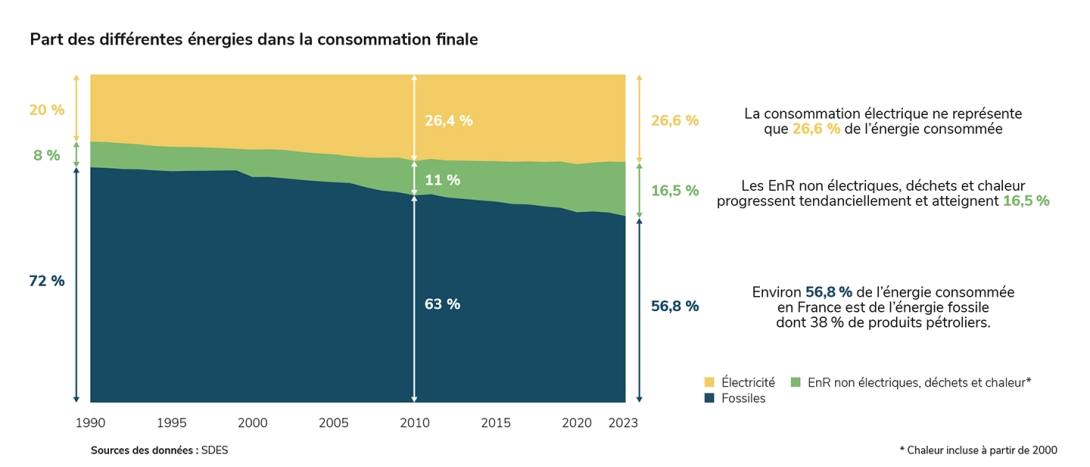
As well as reducing emissions, the electrification of energy consumption also addresses economic and sovereignty issues
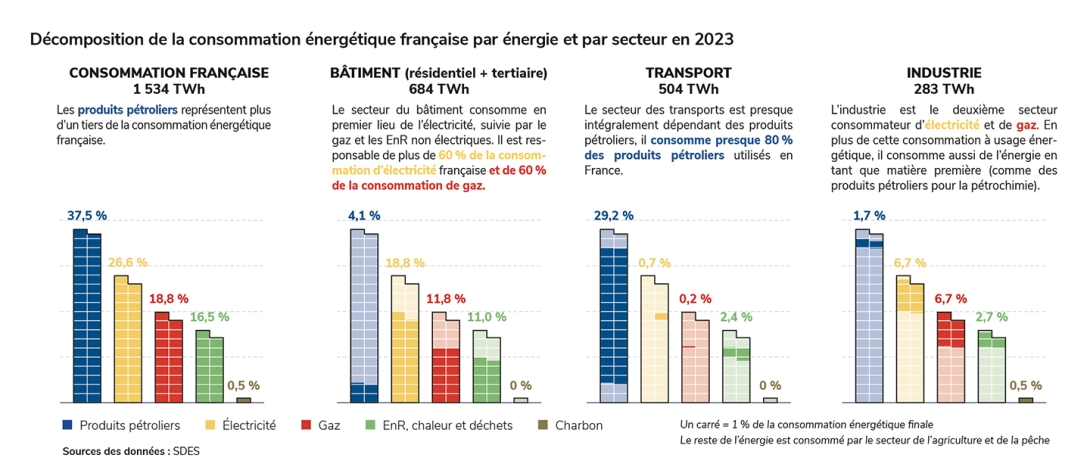
Energy consumption in France is still heavily dependent on fossil fuels, most of which are imported. These represent almost 60% of the country’s final energy consumption3, while electricity accounts for only around 27%.
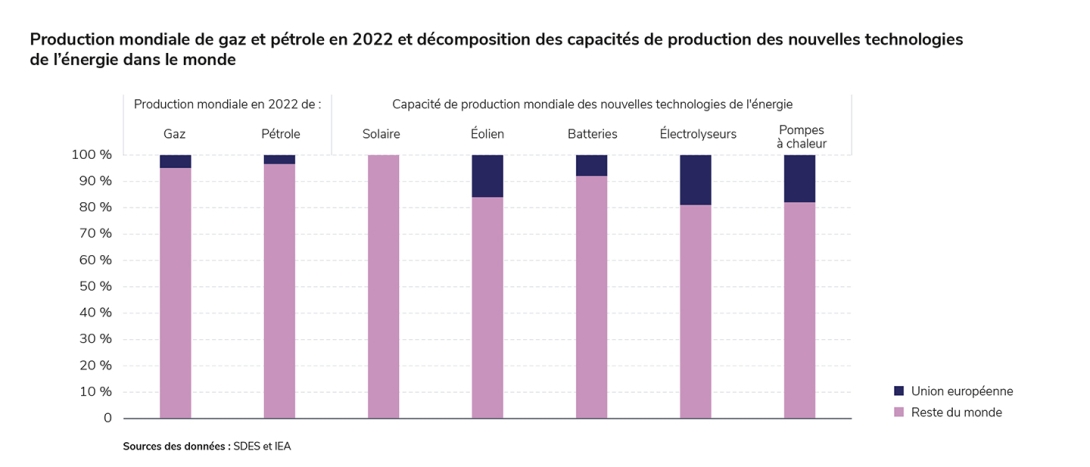
Electrification is also a priority for both economic and sovereignty reasons. Imports of fossil fuels, mostly from non-European countries, cost France between €40 and €60 billion every year (outside exceptional situations). For comparison, record electricity exports earned France €5 billion in 2024. So there is a strong case for using competitive, low-carbon French electricity today to reduce the country’s dependence on fossil fuels. In addition, manufacturing capacity for new energy technologies, except solar energy, has a stronger European component
than oil or gas production.
Most petroleum products are used in the transport sector, particularly road transport. As a result, electrifying road transport is the primary route for decarbonising the sector’s energy consumption. The market share of new fully electric cars reached around 17% in 2024, for the second year running, although fleet renewal times mean that only 2.3% of cars on the road on 1 January 2024 were electric.
Gas is mainly used to heat residential and commercial buildings. The proportion of homes heated mainly with gas is still 35.8%4. To reduce dependence on fossil fuels, these heating systems will gradually have to be replaced by low-carbon alternatives (such as heat pumps). Thermal upgrades are another important means of reducing energy consumption in these sectors. In 2024, the number of large-scale renovations and the grants paid out increased significantly (20,000 homes, amounting to €3.3 billion). In the new-build sector, heat pumps are now the most common form of heating.
One of the challenges in decarbonising industry, where certain sectors are major emitters of greenhouse gases, is adapting the transmission network to guarantee that electricity supply needs are met. RTE has already received many connection requests from industrial companies, electrolysers and data centres, and is adapting its operations to ensure that every customer is connected under the best possible conditions for the country as a whole. The NDP, whose main outlines were announced on 13 February 2025, proposes several strategies to streamline these connections.
The increase in the volume of renewable energy curtailment reinforces the importance of developing demand flexibility now
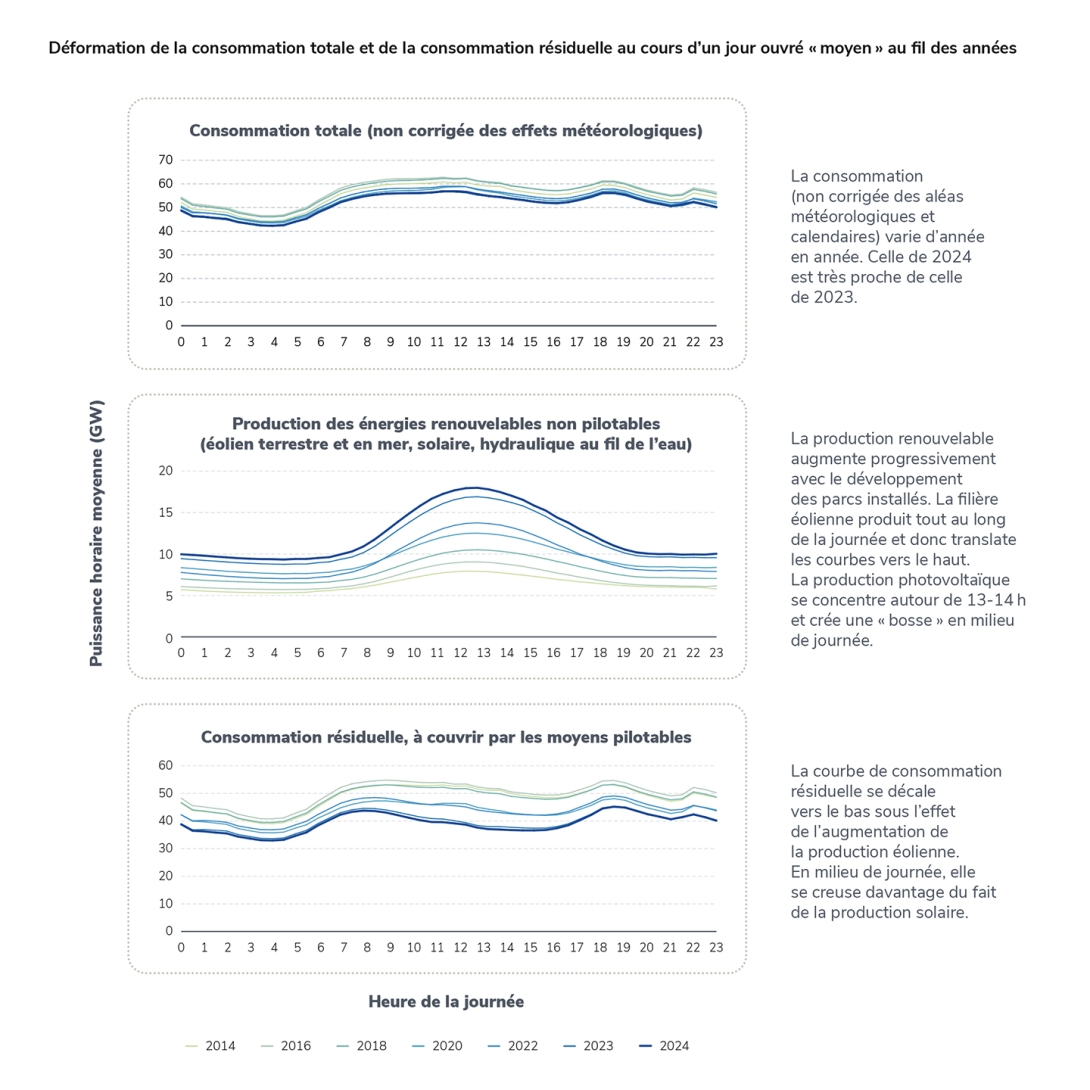
The operation of the power system requires a constant balance between electricity generation and consumption. Until now, maintaining this balance has mainly relied on the flexibility offered by dispatchable generation resources (particularly nuclear and fossil-fired power plants). The use of other sources of flexibility, and particularly “demand flexibility”, i.e. adapting the consumption profile to the generation profile, is becoming increasingly necessary with the growth in the volumes of inflexible renewable electricity produced.
Demand flexibility is not a new concept: it has existed for decades in the French power system in the form of peak and off-peak tariffs, which have made it possible to shift a proportion of consumption from daytime hours, when demand is higher, to night-time hours, when it is generally lower, thanks to a more attractive electricity tariff for consumers. Demand flexibility can respond to structural needs, such as taking advantage of the abundance of solar production in the early afternoon (the peak/off-peak reform, which will be implemented between November 2025 and the end of 2027, is a step in this direction), or to more dynamic needs, such as reacting to uncertainties about weather conditions. The growing electrification of energy uses in the future (transport, heating, hydrogen production) also represents a major source of flexibility for the power system.
A useful indicator for analysing flexibility needs, and particularly structural needs, is the residual demand curve, which shows total demand minus the volume of inflexible renewable generation at any given moment. The shape of this curve is changing: over the last ten years or so, the average level of residual demand has gradually fallen due to the combined effect of increased renewable generation and, over the last four years, lower consumption. In addition, the increase in solar output in the middle of the day accentuates the afternoon trough, leading to a curve characterised by two peaks (morning and evening) and two troughs (night and afternoon).
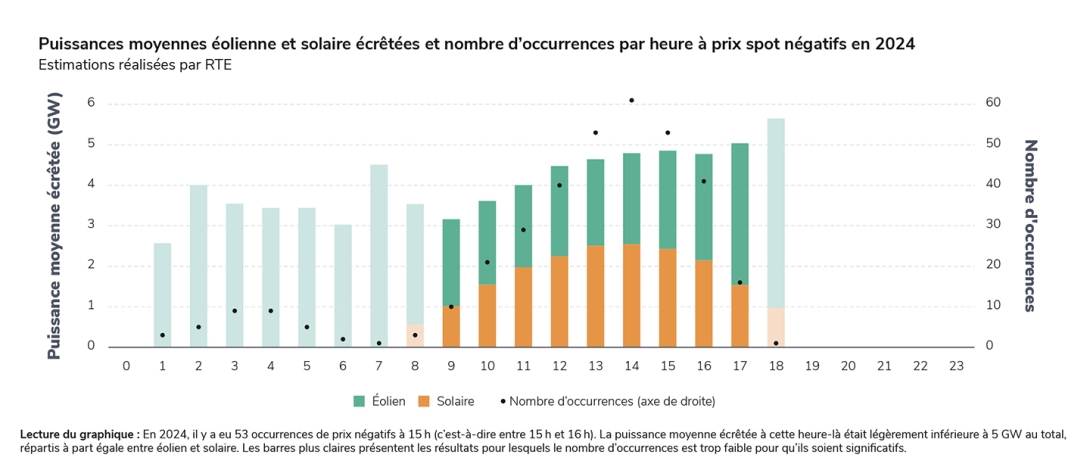
The increase in the volume of renewable energy curtailed at times when spot prices are negative reinforces the importance of developing demand flexibility now. The volume of wind and solar power curtailed in 2024 was 1.7 TWh (made up of 0.9 TWh of wind and 0.7 TWh of solar), compared with 0.6 TWh in 2023. The average power curtailed was 4.5 GW at negative price times (compared with 3.9 GW in 2023), rising to a maximum of 12 GW.
As far as storage is concerned, the capacity of lithium-ion batteries increased by 216 MW in 2024, bringing the total to just over 1 GW, while PSH storage capacity remains stable at almost 5 GW.
1
These values include the volumes of electricity self-consumption in France.
2
Source : Ember
3
57% in 2023, the last year for which data are available.