BE 2025 - Europe [EN]
Sections
Section externalisée
Menu tertiaire
Paragraphes de la section
European electricity consumption remained stable in 2025 after bouncing back in 2024
Gross electricity consumption, i.e. not adjusted for weather and calendar effects, remained relatively stable1 in 2025 (+0.7%) across the European Union2 compared with the previous year.
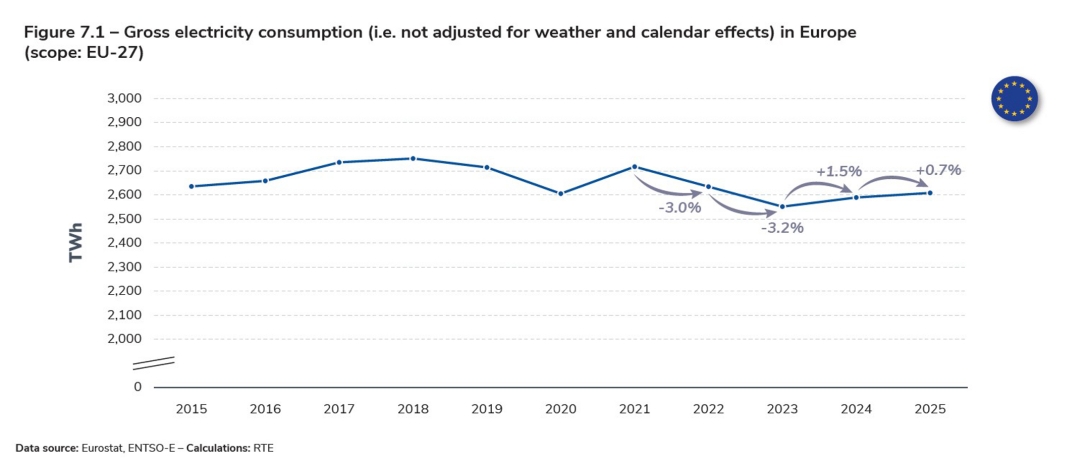
After two years of sharp falls (−3.0% and −3.2%) in 2022 and 2023 due to the energy crisis and warmer winters, European consumption bounced back slightly in 2024 (+1.5%), but remained below the consumption levels before the pandemic and the energy crisis. This was also the case in 2025, with consumption remaining 3.4% lower than the average level between 2015 and 2019.
This stability of consumption at relatively low levels confirms that the drivers of the fall in demand in previous years in Europe have persisted in the short term, and particularly the effects of energy efficiency and energy sufficiency initiatives as well as the drop in industrial production in several countries, partly due to the global macroeconomic context.
For the time being, the effects of electrification remain hardly visible, despite (still-limited) progress in electrification rates in some countries. Electrification is a key component of many European countries’ medium-term strategies for reducing their reliance on fossil fuels. In certain scenarios3, for example, Germany could see its consumption rise by almost 80% over the next 10 years, and Spain and the UK by almost 45%.
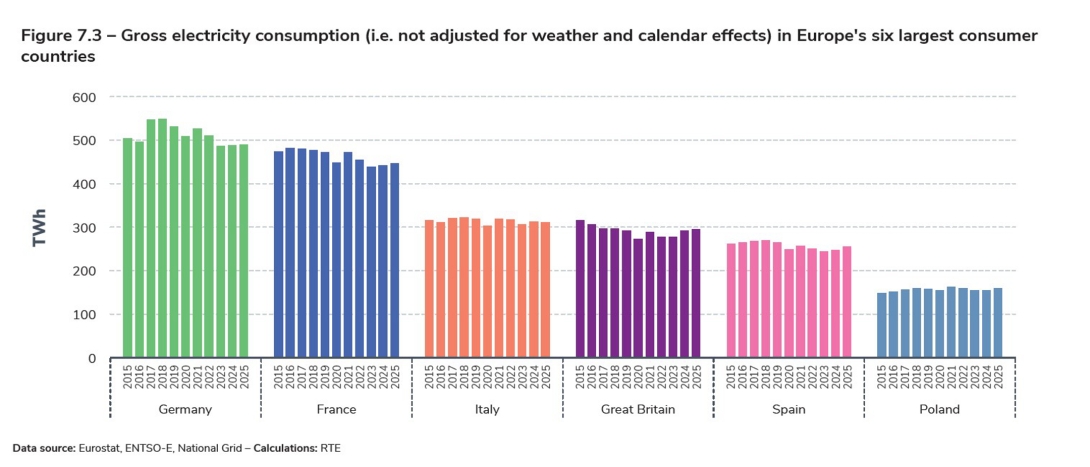
The changes in consumption in 2025 were fairly mixed across the different countries, and less significant than those in 2024 compared with 2023. In the three biggest consumer countries (Germany, France and Italy), consumption remained relatively stable between 2024 and 2025.
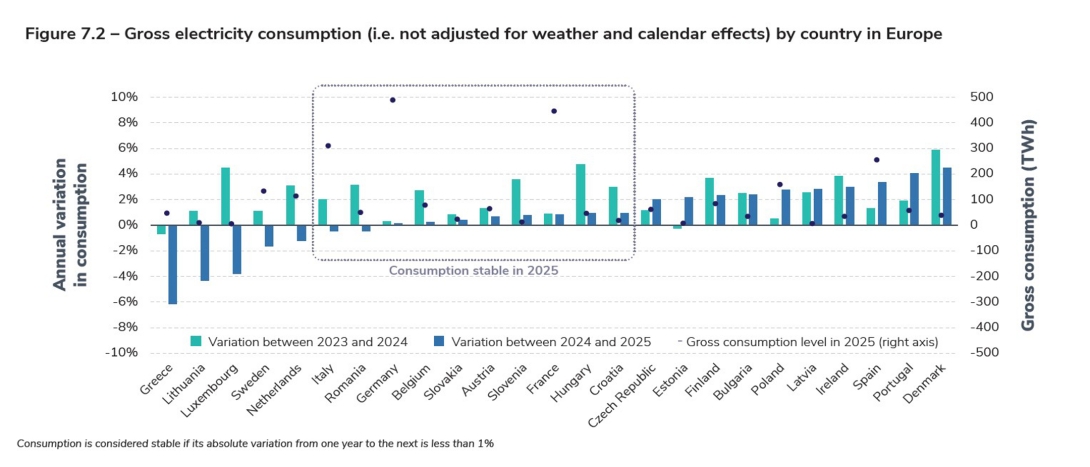
However, some countries stand out from the general trend. In Greece, the sharp drop in consumption (−6% compared with 2024) was concentrated in June, July and August (−13% on average compared with the same months the previous year). Greece is the hottest country in the EU, particularly in summer, so use of air conditioning there is significant. The summer of 2024 was the hottest on record, with an average temperature of 27.7°C. The summer of 2025 was slightly cooler, so electricity consumption in Greece was lower between June and August
2025 than the previous year, with a marked effect on annual consumption.
Conversely, Denmark was the country with the biggest increase in consumption in 2024 (+6%) and 2025 (+5%). It is also one of the European Union countries where the pace of electrification has increased the most over the last ten years (+7 points4, against an average of +3 points in the EU-27), indicating the structural nature of this increase in consumption. The rise of electricity as a proportion of final energy consumption can be seen in all sectors, including the development of electric vehicles (Denmark is the EU country with the highest rate of electric vehicle ownership5), the increased use of heat pumps in housing and the development of data centres6. Denmark was also the EU country with the strongest growth in industrial production in 2024 and 2025, which has also contributed to the upward trend in electricity consumption.
After a slight increase in 2024, Spanish consumption rose by 3% in 2025. A large part of this increase was concentrated in March and June. March 2025 was the wettest month since 20187, resulting in higher humidity and a drop in mid-month temperatures of three to four degrees compared to March 2024, resulting in an increased need for energy for heating. June 2025 was the hottest June on record in Spain, at 0.8°C above the previous record set in 20178, and even exceeded average July–August temperatures. Against this backdrop, consumption rose by 2.4 TWh in June compared with the same month the year before, representing almost a third of the increase in Spanish consumption over the year.
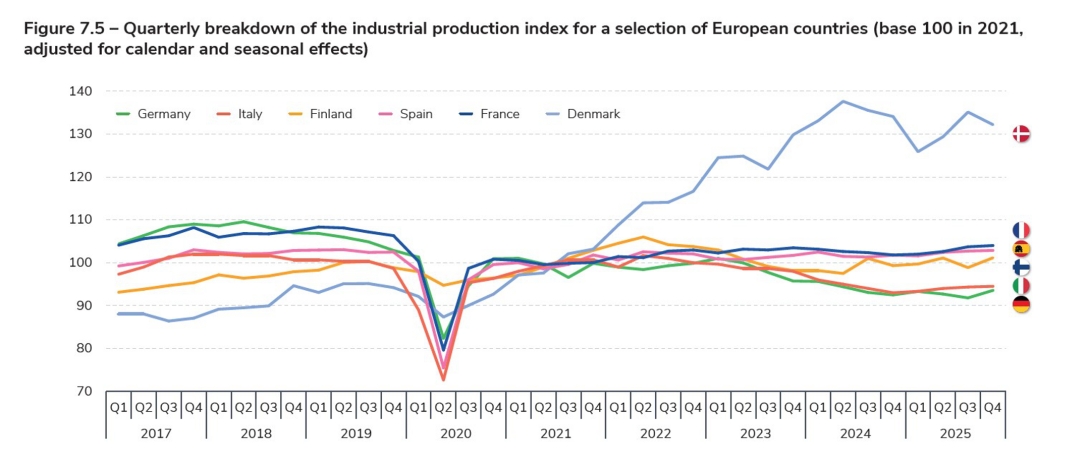
The decrease or stagnation in consumption in some countries in recent years can be attributed in part to the decline in industrial production.
Among these countries, Germany and Italy are the EU's two largest industrial producers, accounting for around 45% of its total manufacturing output. They are also among the countries whose industrial production recorded the sharpest falls in 2024, followed by a slight recovery during 2025 for Italy. In Germany, industrial production continued its decline over 2025, despite an inversion of the trend in the fourth quarter. This fall reflected particularly high electricity prices compared with competitor countries, especially for energy-intensive sectors such as the automotive and steel industries, under the lingering effects of the 2022 energy crisis. The German government is considering a plan to subsidise electricity prices for these
sectors from 2026 until 20289.
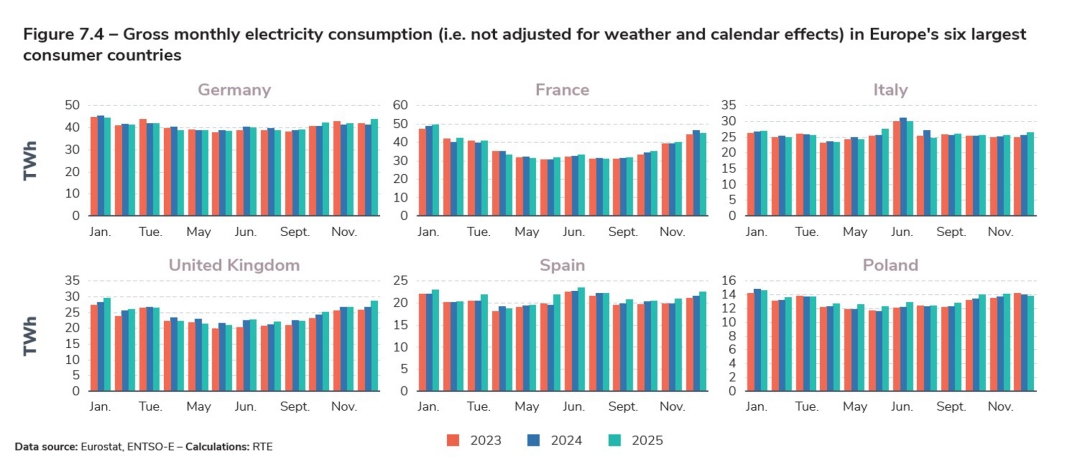
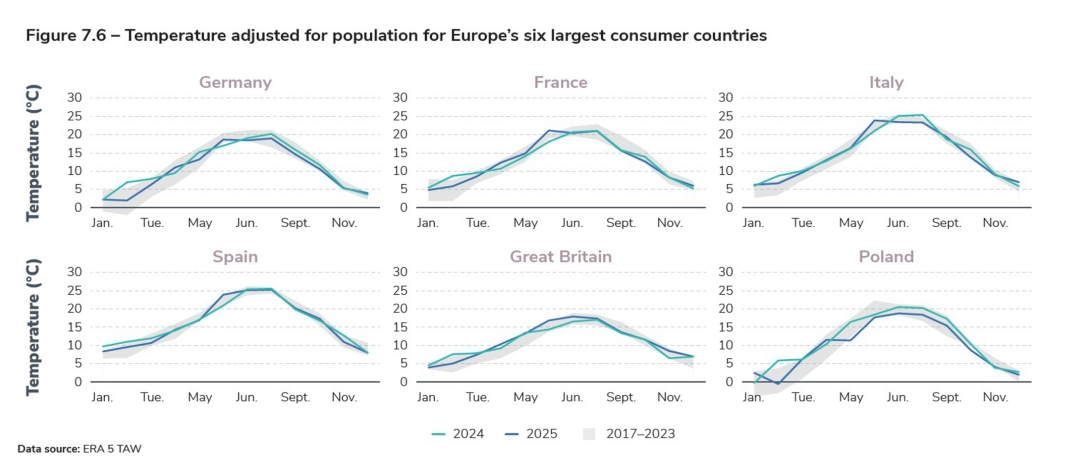
In general, temperatures were lower at the start of 2025 than at the same time in 2024. While this difference led to a one-off increase in consumption in France and Spain, its effect on consumption was less visible in other countries, where the other factors mentioned had a predominant effect.
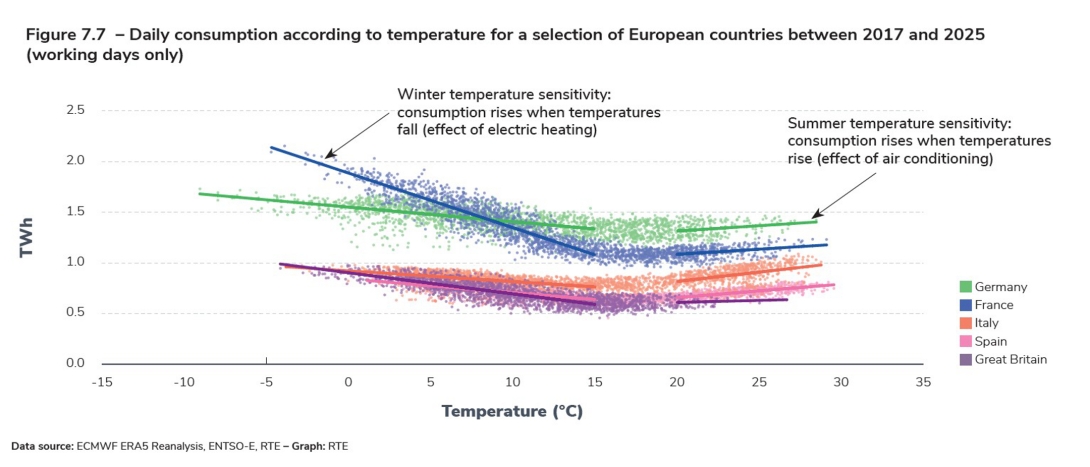
Electricity consumption in European countries has historically been temperature-sensitive, to varying degrees, driven by the use of electric heating in
autumn and winter and air conditioning in summer. While all European countries experience temperature sensitivity in winter, this is currently more pronounced in France than in other countries, including countries with colder winters such as Germany, due to the greater use of electric heating. For example, French consumption in January, February and March is around 20% higher than in other months, compared with less than 10% in Germany. The difference is particularly marked in January, the coldest month of the year, when consumption levels in France are generally the highest of the year.
Conversely, in other countries such as Spain and Italy, electric heating is less common due to the relatively high proportion of fossil-fired electricity generation in
the electricity mix between 1970 and 2000 (when heating was electrified on a large scale in France), which made the use of electric heating less attractive. These countries have historically favoured gas or oil-fired heating. In these two countries, electricity consumption from January to March is therefore relatively similar to other months (+4% on average for Spain and +1% for Italy). Conversely, consumption peaks in July, one of the hottest months of the year, when it is significantly higher than in other months (+10% on average in Spain, +18% in Italy). Consumption in August is lower than in June, mainly because of the drop in economic activity due to the summer holidays.
The increase in consumption for each degree lost at low temperatures has remained almost constant over the last ten years in the countries analysed (the five countries with the highest consumption). Although electric heat pumps are beginning to gain ground, they are mainly installed in new, well-insulated buildings and thus have a limited impact on winter consumption. In the medium term, however, the development of electric heat pumps needs to accelerate in order to meet climate targets, and should also affect older homes (through renovation efforts), which could ultimately contribute to increasing the temperature sensitivity of electricity consumption in winter in many European countries.
1
The analysis in based on consumption not adjusted for weather and calendar effects, as consumption data adjusted for these effects is not available for
other European countries. As 2024 was a leap year, the increase between 2023 and 2024 would have been slightly lower without this effect (+1.2%)
and slightly higher between 2024 and 2025 (+1.0%).
2
The scope considered here is the European Union of 27 member states. The United Kingdom is not included, even in the pre-Brexit years, in order to
maintain a constant scope and facilitate analysis.
4
Source: Our World in Data, variation between 2015 and 2024
5
European Commission, European Alternative Fuels Observatory, 2024
6
Energistyrelsen, Årlig energistatistik, 2024
9
France24, German plans to lower industrial power costs from January, November 2025
Section externalisée
Menu tertiaire
Paragraphes de la section
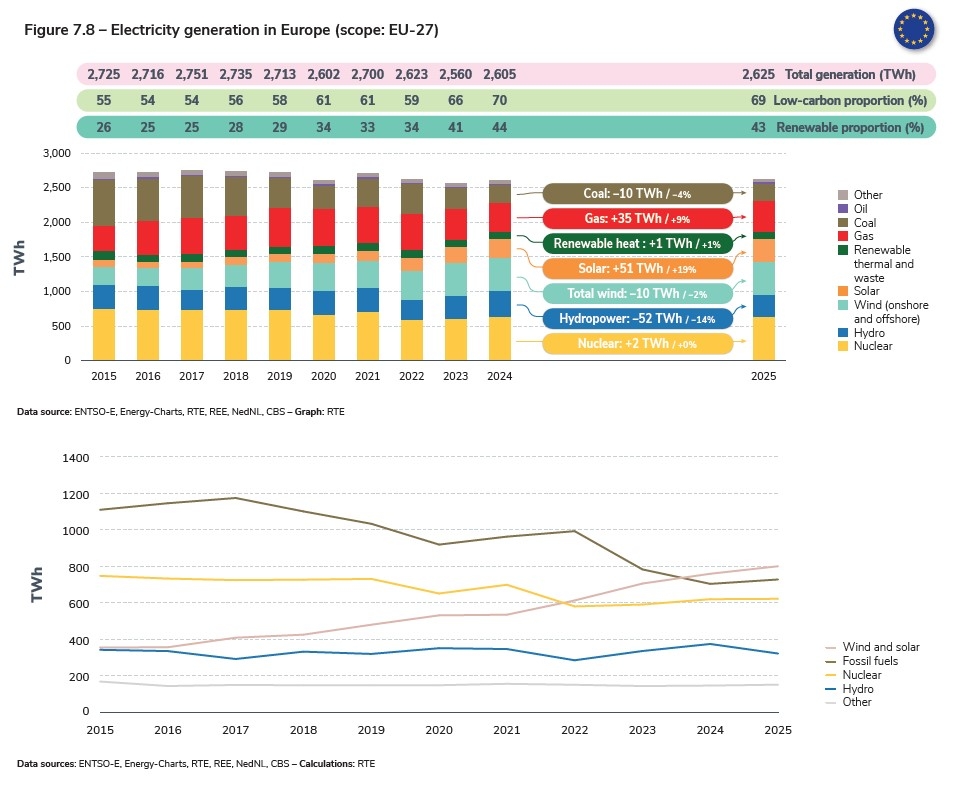
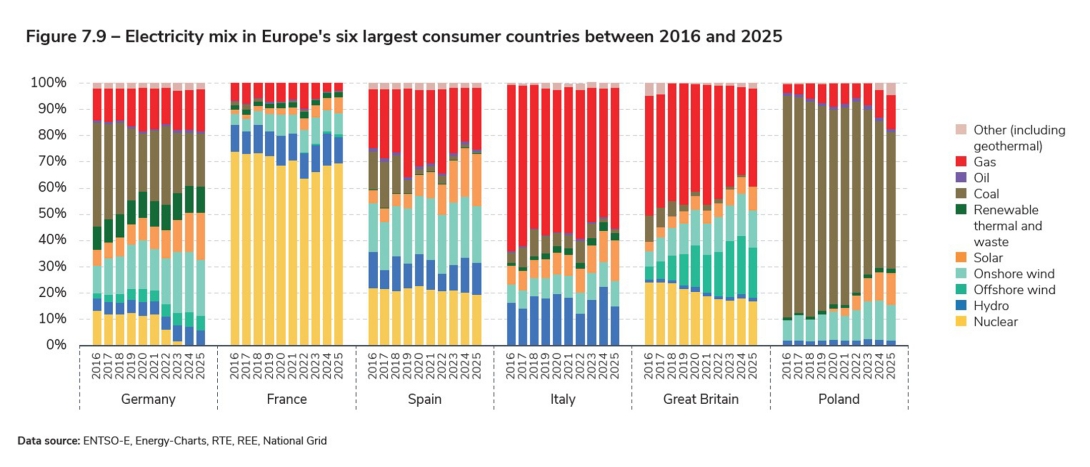
Total electricity generation remained stable in Europe, with solar and wind production outstripping fossil fuel output for the second year running
In line with the stagnation in electricity consumption, the volume of electricity generated within the European Union also remained relatively stable in 2025 compared with 2024 (+0.8%, +20 TWh), though with marked variations across the energy mix.
With an increase of 19% (+51 TWh, including only +8 TWh in France) in 2025 compared with 2024, solar output showed the strongest growth, at a similar rate to the previous year. Wind generation fell slightly (−2%, −10 TWh) due to less favourable weather conditions than in 2024.
Hydropower production fell significantly in 2025 (−14%, −52 TWh), after an exceptional year in 2024, returning to a level close to the average of the previous ten years. Against this backdrop, fossil-fired generation rose slightly (+3%, +24 TWh), mainly driven by gas, while coal-fired generation continued to decline (−10 TWh or −4%) and now represents less than 10% of the generation mix.
Despite this, combined solar and wind output exceeded fossil generation for the second year running. Nuclear and renewable thermal generation volumes remained stable.
Solar
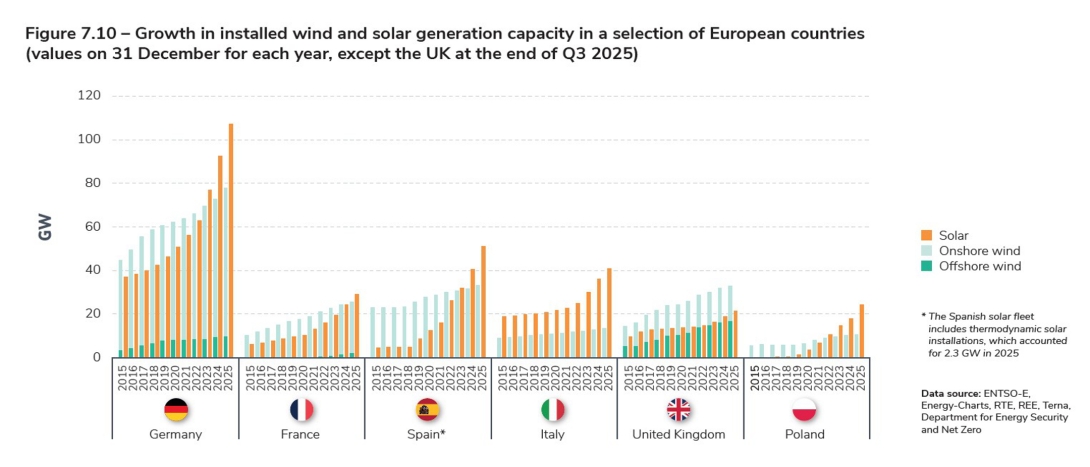
The increase in solar output (+51 TWh or +19%) is similar to the previous year (+46 TWh or +20%). The volume generated across the European Union almost tripled in 2025 compared to its 2019 level. Solar generation rose in all countries, driven largely by the increase in the size of the fleet10. Better sunshine than in 2024 also contributed, though to a lesser extent. As a result, solar generation exceeded hydropower output in the EU for the first time.
The pace of solar capacity growth remained high in the European Union, having reached record levels in several countries in 2024. Notably, Germany installed 14.8 GW in 2025, the second highest growth rate in recent years behind the 15.5 GW installed in 2024. Similarly, Italy installed 5.1 GW in 2025, compared with 6 GW in 2024. This slight decline is due to a drop in residential installations. Spain was one of the few countries to have installed more solar capacity in 2025 than in 2024: 10.4 GW compared with 8.7 GW. It was also the first European country where the share of solar-generated electricity in the production mix reached 20%. Germany was close behind, with an 18% share of the mix.
Wind
Wind generation fell slightly (−10 TWh, −2%) as a result of unfavourable wind conditions, despite the continued increase in the size of the European wind-powered generating fleet. This slight fall did not interrupt the momentum of wind power, since generation in 2025 was identical to the 2023 figure and remains the second highest behind 2024; it was almost twice as high as in 2015.
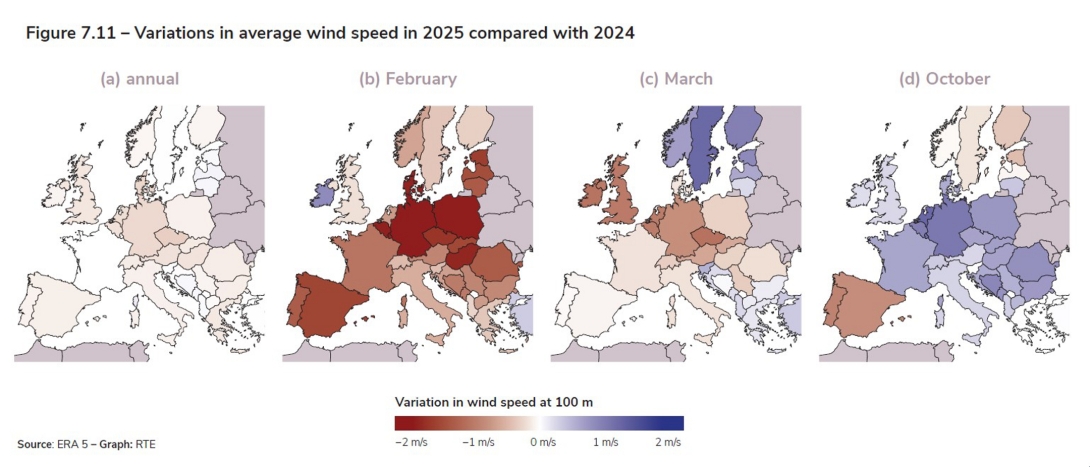
While generation from offshore wind farms was almost identical to 2024, it was onshore wind farms that saw their output fall, particularly at the beginning of the year. The months of January to April saw a sharp fall (particularly clear in February), which was partly offset by higher output in May, June and especially October.
Despite the slight drop in wind generation and the slight rise in gas-fired generation, wind output (onshore and offshore, around 480 TWh) remained higher than gas-fired generation (around 450 TWh) for the second year in a row.
The installation of new onshore and offshore wind capacity continued at a relatively steady pace in most European countries, but more slowly than the growth of solar power.
A detailed analysis of wind profiles across the different countries reveals contrasting trends. On an annual scale, all the European countries except the Scandinavian countries experienced less favourable wind conditions in 2025 than the average for the period between 2015 and 2024. The Nordic countries were not affected by the drop in wind output at the beginning of the year, benefiting from very favourable winds in March, while the fall in January and February was limited. Meanwhile, Ireland was not affected by the February lull like the rest of Europe. Even if wind patterns are correlated between neighbouring countries, the diversity of situations illustrates the usefulness of electricity trading, which makes it possible to partially compensate for different wind profiles.
Overall, the share of wind and solar power in the European energy mix rose by two percentage points, from 29% to 31%.
Hydropower
Hydropower generation reached an exceptional level in 2024, achieving its highest value in the last decade, thanks to very high rainfall. As a result of a less rainy year, hydropower generation fell sharply in 2025 (−52 TWh, −14%), though it remained at a level close to the 2014–2023 average. The drop in output was particularly marked in the countries surrounding the Alps (around −20%), while the countries on the Iberian peninsula saw their production stagnate or fall slightly (+1% for Portugal, −4% for Spain). Northern European countries such as Norway and Sweden even saw a slight increase (+4% in Norway and +6% in Sweden).
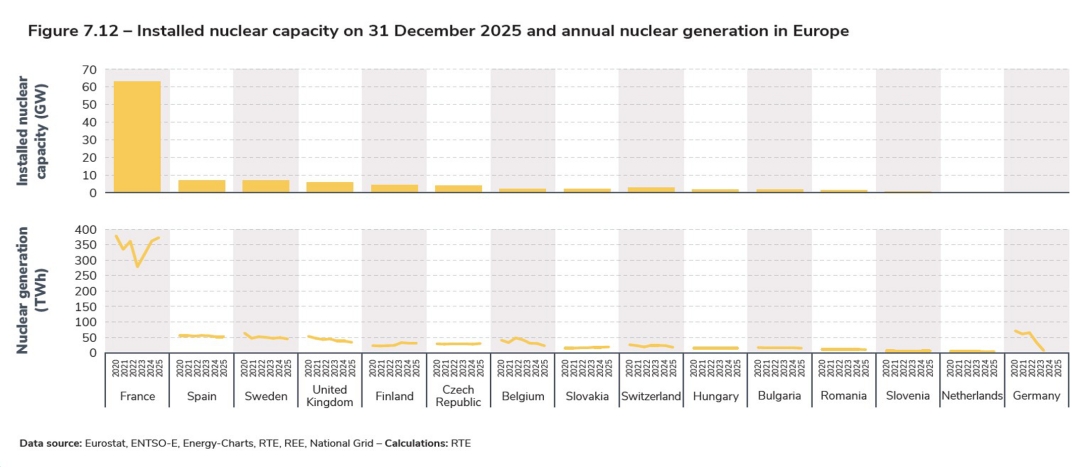
Nuclear
Nuclear generation in Europe remained stable overall in 2025 (+2 TWh, +0.3%). While French generation increased compared with 2024 (+11 TWh), output across the other countries fell by almost as much, particularly in Belgium and Sweden. Outside the European Union, nuclear generation also fell in Switzerland and Great Britain. Only the Czech Republic and Slovakia recorded significant increases in their output in 2025.
In Belgium, three reactors were shut down in 2025 (Doel-1 at the beginning of the year, Tihange-1 and Doel-2 in the autumn) as part of the process of phasing out nuclear power adopted in 2003, following two other reactor shutdowns in 2022. As a result, nuclear generation fell by 7 TWh (−24%) compared with 2024, and nuclear's share of the generation mix reached 33% in 2025, compared with 51% in 2021. The two reactors remaining in operation (commissioned in 1985), Doel-4 and Tihange-3, were originally due to close in September 2025, but their lifespan was extended by ten years in 2022: now they are scheduled to close in 203511. In addition, a parliamentary vote in March 2025 repealed the 2003 law, opening up the possibility of reopening existing reactors or building new plants.
In Sweden, the drop in nuclear generation (−4 TWh, −8%) was cyclical. It was due to the country's largest reactor (Oskarshamn 3, with a capacity of 1.45 GW) being shut down from April to October: the initial outage for maintenance and refuelling was extended due to the discovery of a crack in a difficult-to-access pipe in the primary circuit
In Finland, output from the Olkiluoto 3 EPR, commissioned at the end of 2022, was stable in 2025 compared with previous years, at 10.1 TWh, as was output from the country's entire nuclear fleet. The commissioning of this reactor increased the nuclear share of Finland's electricity generation mix from an average of 35% over the period 2012–2021 to 40% since then.
The Czech Republic is one of the few countries where nuclear generation increased in 2025 (+2.2 TWh or +8%), reaching its highest level in the last thirteen years. This increase is mainly due to the two reactors at the Temelin power station, which were only shut down once in 2025 due to investment to extend the fuel cycles12. The nuclear share of the Czech electricity mix reached an all-time high of 42% in 2025.
In Slovakia, reactor 3 at the Mochovce power station was commissioned in 2023. Construction of the reactor began in 1987 but was interrupted by the collapse of the USSR and then resumed in 2008. Its output increased in 2024 and 2025 (3.6 TWh), helping Slovakia's nuclear generation to increase by 1.1 TWh in 2025 (6%). Construction of reactor 4 also began in 1987, and then suffered the same setbacks. It could be brought into service in 2026, following tests conducted in 2025.
Outside the European Union, Swiss nuclear generation fell by 4.6 TWh between 2024 and 2025 (−20%) due to the extended shutdown of a reactor for an essential upgrade to the water supply system13. In Great Britain, generation fell by 4.2 TWh (−11%) between 2024 and 2025, mainly due to low fleet availability14. Total generation reached 34.1 TWh, the lowest level since 2012, partly because of the closure of 11 end-of-life reactors between 2000 and 2022. Five reactors are still in service, with a total installed capacity of 6.5 GW. Finally, Ukraine has around 13 GW of nuclear capacity, with annual output of between 50 and 100 TWh, putting the country ahead of Spain in terms of production. Nuclear output accounts for around 50% of the country's electricity generation mix, although no recent figures have been published since the large-scale invasion by Russia.
Fossil fuels (gas, oil, coal)
The sharp drop in hydropower generation led to a slight cyclical increase in fossil-fired generation in the European Union in 2025 (+24 TWh, +3%), following two years of sharp decline (−21% in 2023 and −10% in 2024). The increase was driven by gas-fired generation (+35 TWh, +9%), while coalfired generation continued to fall (−10 TWh, −4%).
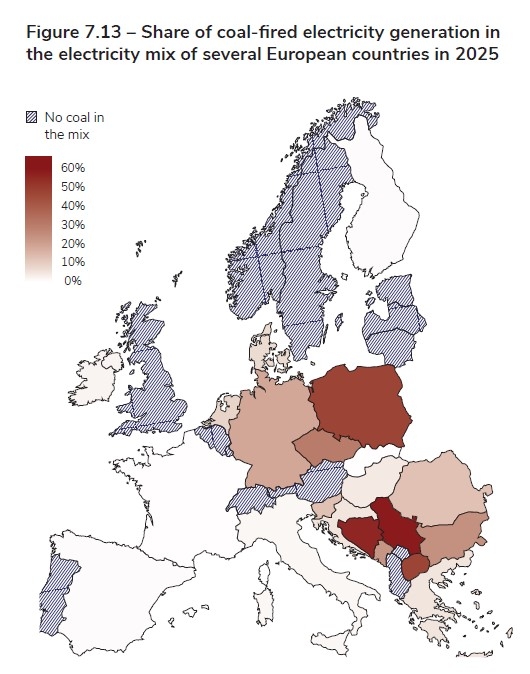
As a result, the increase in fossil generation in 2025 did not undermine Europe's pathway to phasing out coal, despite some delays due to the geopolitical context. In Italy, for example, the last two coal-fired power stations in operation, representing capacity of almost 4 GW, were due to close in 2025, but this closure was postponed indefinitely in September15 due to uncertainty over the security of the gas supply in Europe. In Spain, out of the last three coal-fired power stations still in operation, Aboño (916 MW) is being converted to gas16 and the other two produced very little in 2025 (<400 GWh). In Ireland, the last coal-fired power station, Moneypoint, was mothballed in 2025 and will remain so until 2029.
Other countries have completed their phase-out of coal in recent years: Belgium in 2016, Austria and Sweden in 2020, Portugal in 2021 and Great Britain in 2024. As a result, coal accounts for a negligible, if any, share of the electricity production mix in most European countries. Of the remaining countries, Poland, Germany and the Czech Republic account for over 80% of coal-fired generation in the European Union. Even in these countries, however, the share of coal continues to fall sharply year on year. In Germany, for example, coal-fired generation has fallen by 60% in 10 years, and its share of the mix has declined from 40% in 2016 to 20% in 2025.
10
SolarPowerEurope estimates the solar photovoltaic capacity installed in the EU at 65.1 GW, an increase of 19%. Source: SolarPower Europe (2025): EU Solar Market Outlook 2025-2030
11
AFCN, Exploitation à long terme (LTO) de Doel 4 et Tihange 3 jusqu’en 2035, November 2025
12
Skupina CEZ, Temelín překonal historický výrobní rekord, December 2025
13
14
Department for Energy Security & Net Zero, Energy Trends, September 2025
15
Reuters, Gas storage levels in Italy and Europe are good, Italian minister says, September 2025
Section externalisée
Menu tertiaire
Paragraphes de la section
The carbon content of electricity generated in the European Union fell by more than 40% between 2017 and 2025
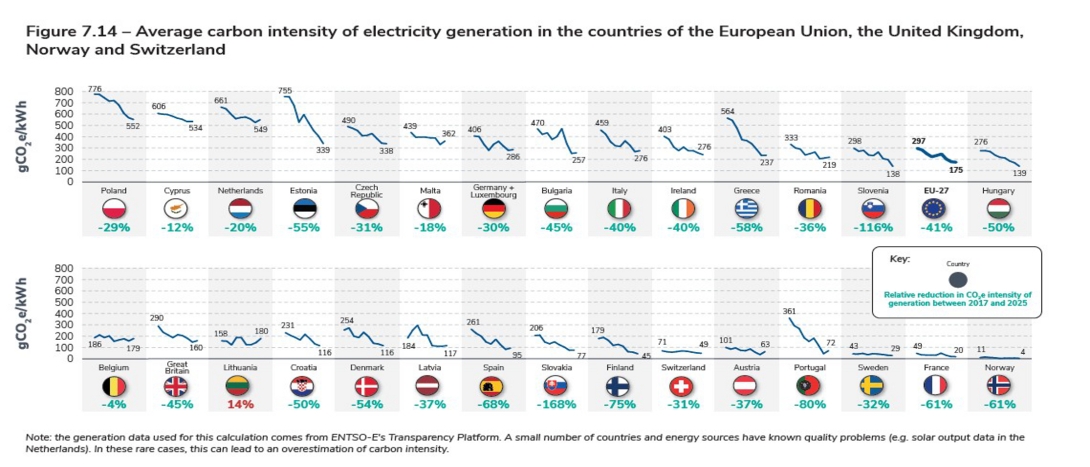
The decarbonisation of Europe’s power system is continuing. Between 2017 and 2025, the average carbon intensity of the electricity produced in the 27 European Union member states fell by 41%, from 297 gCO2/kWh in 2017 to 175 gCO2/kWh in 2025. Over this period, the carbon content fell in all member states (but also in other European countries such as Great Britain, Norway and Switzerland), except for Lithuania17. French electricity generation has long been among the lowest-carbon in Europe, and is now second only to Norway. In some countries, the speed of decarbonisation is spectacular. Thanks to the massive development of renewable energy, particularly wind, and the closure of most of their coal-fired power stations, Spain and Portugal reduced the carbon intensity of their electricity generation by 68% and 80% respectively over the period. The closure of coal-fired power stations has enabled countries such as Greece, Bulgaria and Great Britain to halve the carbon intensity of their generation mix.
17
This increase can be explained by the fact that the Lithuanian power system is relatively small (annual consumption is in the region of 10 TWh), and highly dependent on imports (between 2017 and 2025, imports from Sweden, Poland and Latvia covered between 25% and 60% of the country's electricity consumption, depending on the year); the carbon content of electricity generation is therefore also highly variable, depending on the volume still to be covered by domestic generation.
Section externalisée
Menu tertiaire
Paragraphes de la section
Battery storage is developing strongly and changing in scale
Battery storage is one of the levers that can contribute to the flexibility of the power system, in addition to others such as dispatchable generation resources, the (downward) flexibility of wind and solar installations and demand-side flexibility. In many countries, batteries already contribute to balancing supply and demand in near-real time, and increasingly to flexibility on longer time scales of up to a few hours (e.g. storing energy when solar generation is high during the day and releasing it at night). The economic space for these sources of flexibility in the years to come will depend on trends in consumption and generation.
In 2025, the total capacity of batteries deployed on the European grid was between 16 and 19 GW, plus equivalent capacity of residential storage. The United Kingdom is ahead of the other countries, with 7 GW installed on the grid, followed by Germany, Italy, France and Ireland, each with total capacity of 1 to 3 GW18.
Batteries can be installed in homes, often coupled with a photovoltaic system, which increases the rate of self-consumption of the electricity generated. They typically have a capacity of a few kilowatts and can deliver electricity at full power for one or two hours. For example, residential storage accounts for 80% of the stationary batteries installed in Germany19 (in terms of stored energy), the country where this type of battery is developing fastest due to the level and structure of tariffs for households.
Industrial projects, generally larger than one megawatt, contribute to the various markets (system services, balancing mechanism, wholesale market); they can also be installed by the operators of large wind or solar farms to store surplus electricity and re-inject it at other times. These projects are growing fast, in both size and number: over the last fifteen years, they have moved from the demonstrator stage, with a capacity of around 1 MW, to industrial projects of several hundred MW, with a storage time of one to two hours. In particular, the number of battery farms larger than 100 MW commissioned annually has risen sharply in recent years, from just one site in 2020 to nine in 2025.
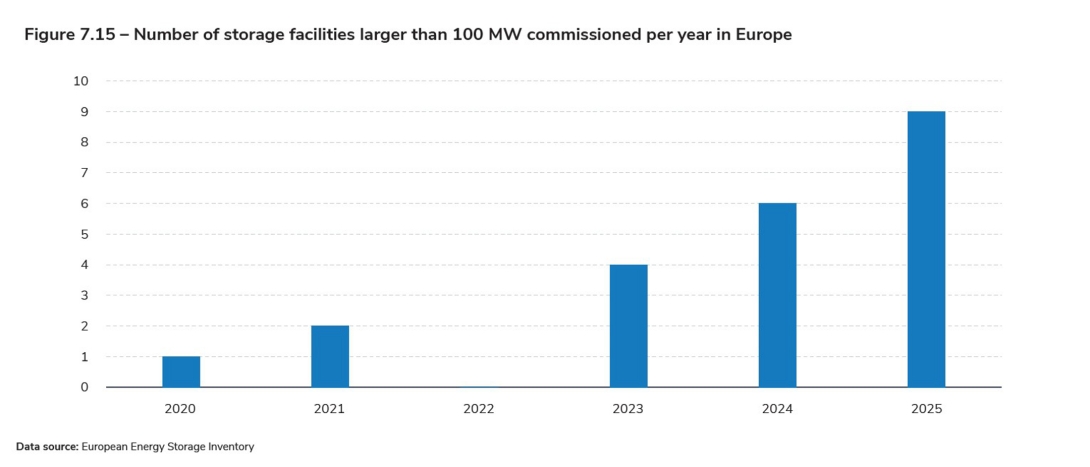
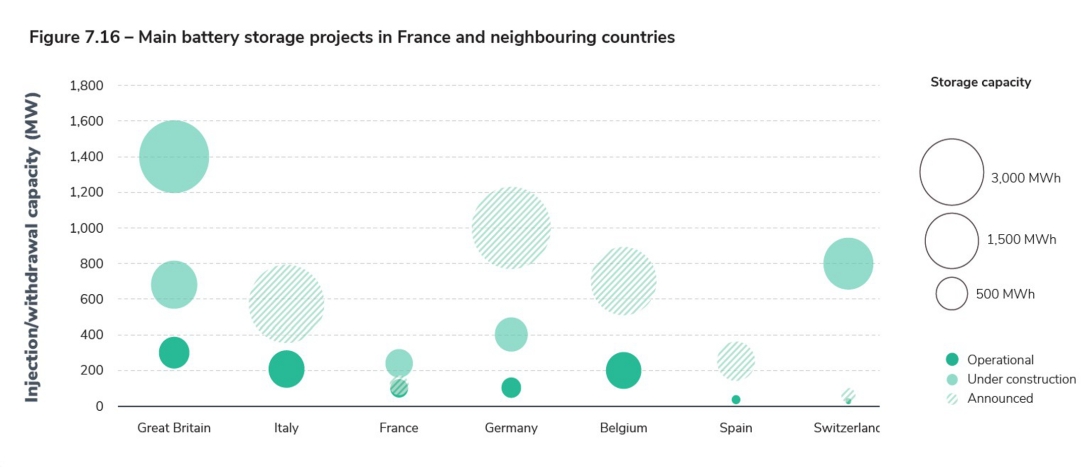
The capacity, in terms of storage time, of projects under construction or announced is also trending upwards: the largest can represent the equivalent of the energy generated by a nuclear reactor for two to four hours.
Some battery storage projects announced in 2025 have even reached the gigawatt mark, with storage capacity for several hours:
- The 1.45 GW/3.1 GWh Thorpe Marsh project (approximately two hours of storage at full power) in Yorkshire, England, developed by Fidra Energy Ltd; construction began at the end of 2025 and the site should be operational by the end of 2027.
- The GigaBattery Jänschwalde 1000 1 GW/4 GWh project in eastern Germany (four hours of storage at full power), developed by LEAG Clean Power GmbH, was announced in 2025 and should be operational in 2027–2028.
Several countries have set up support mechanisms to encourage projects with longer storage times (over four hours), equivalent to what PSH can offer, and thus facilitate renewable energy integration:
- In Italy, the Mercato a termine degli stoccaggi (MACSE) tender, announced by Terna in September 2025, aimed to select battery storage projects for commissioning in 2028. This call for tenders operates like a capacity market, with successful bidders receiving compensation in exchange for the obligation to offer their storage capacity on a dedicated platform. A total of 14 storage projects were selected, offering 1.5 GW and 10 GWh of storage in total. The projects vary greatly in size, from 34 to 574 MW, but all offer between six and eight and a half hours of storage20. These projects will receive between €12,000 and €16,000/MWh per year for 15 years.
- In the UK, following a government decision in 2024, the energy regulator (Ofgem) issued public tenders for Long Duration Energy Storage (LDES) with capacity for eight hours. Selected projects will benefit from a cap and floor CfD-type scheme. Ofgem found that 77 projects were eligible in 2025, representing a total of 29 GW, including 20 GW of Li-ion batteries for delivery between 2030 and 2033. The final selection should take place in summer 202621.
- Spain announced it was allocating €827 million to 133 storage projects in 2025. These projects should be operational by 2029, totalling 2.3 GW and 10 GWh of storage22.
18
Sources: European Energy Storage Inventory, Aurora Energy Research, Solar Power Europe, Clean Horizon Consulting
19
Chair for Electrochemical Energy Conversion and Energy Storage Systems, Battery-Charts, 2025
22
Instituto para la Diversificación y Ahorro de la Energía, Resolución definitiva, Table 1 p227, December 2025
Section externalisée
Menu tertiaire
Paragraphes de la section
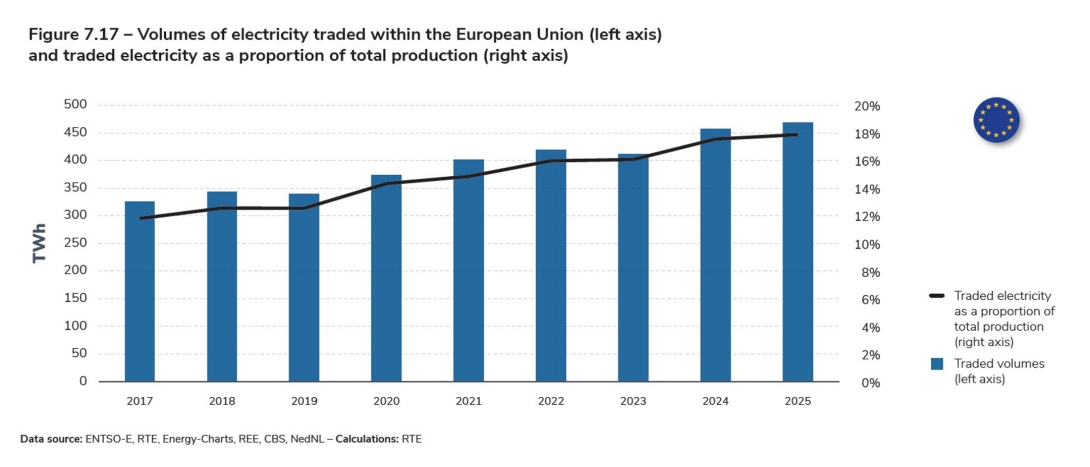
European electricity trading continued to play its role to the full in optimising the electricity generation mix on a continental scale in 2025
In 2025, 468 TWh were traded between European Union countries, amounting to around 18% of total generation and a similar level to 2024. These volumes have tended to increase over the last twenty years as a result of growth in interconnection capacity on one hand and success in developing the integration of Europe’s markets on the other. This integration facilitates electricity trading so that low-cost, low-carbon resources (renewable, nuclear) can be given priority throughout the interconnected system, including in neighbouring countries, before more expensive fossil-fired resources. This minimises the cost of electricity generation across the interconnected zone.
Trade between EU countries and their non-EU neighbours is much lower in volume terms. Over the last ten years, it has not exceeded 20 TWh in either direction. In 2025, the European Union was a net exporter of electricity to neighbouring countries to the tune of 18 TWh, slightly more than in 2024 (7 TWh), in contrast to previous years since 2017,when it had a slight trade deficit. This development is mainly due to three trends:
- The balance of the European Union's trade with Ukraine was negative before 2023, with imports of 3 TWh on average; it then turned slightly positive, at 0.5 to 4 TWh depending on the year.
- The balance of trade with Great Britain has almost always been on the export side over the period from 2018 to 2025, with the exception of 2022; its value increased from 19 TWh in 2023 to 28 TWh in 2025.
- The deficit with Switzerland was almost wiped out in 2025, moving from 14 TWh of imports in 2024 to 0.3 TWh of imports in 2025.
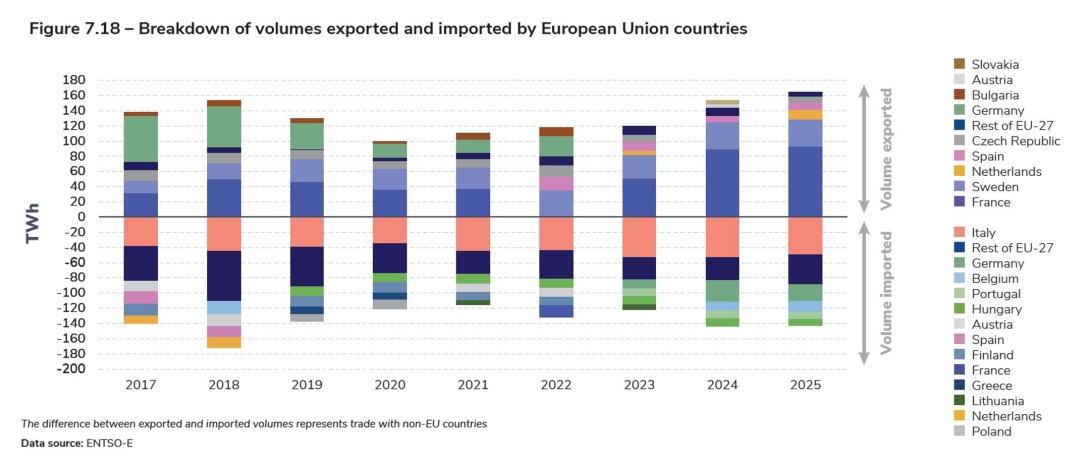
Country by country, 2025 did not reverse any trends in trade balances compared with the previous year. As in 2024, France had the highest export balance in Europe, setting a new record (92.3 TWh in 2025 compared with 89.0 TWh in 2024 – see the Trading chapter). French net exports accounted for more than half (56%) of all exports from EU countries. Also as in 2024, Sweden's trade balance was in surplus, second only to France. Sweden has been a net exporter since 2017, but its surplus has more than doubled in absolute terms over that period (35 TWh in 2025 compared with 16 TWh in 2017), driven by an increase in wind generation in the same proportions (from 17 TWh in 2017 to 38 TWh in 2025).
Italy was still the country with the highest net import balance among EU countries in 2025, accounting for a third of total imports. Looking at the wider scope, i.e. tracing trade flows beyond directly neighbouring countries23, France was the leading exporter to Italy in both 2025 and 2024, covering two-thirds of Italian imports (33 TWh, 66%); the other main countries where Italian imports originated, well behind France, were Switzerland (3.4 TWh, 7%) and Sweden (2.8 TWh, 5%).
For most countries, trading trends are influenced by changes in the generation mix: in general, the volume exported increases when low-carbon generation is plentiful (solar, wind, hydro and nuclear). Decarbonising the mix helps to make electricity generation more competitive, which has a positive impact on export volumes and thus on the balance of trade. This effect can be seen in several countries: France first of all (see detailed analysis in the Trading chapter), but also the Netherlands, Austria, Belgium and Spain.
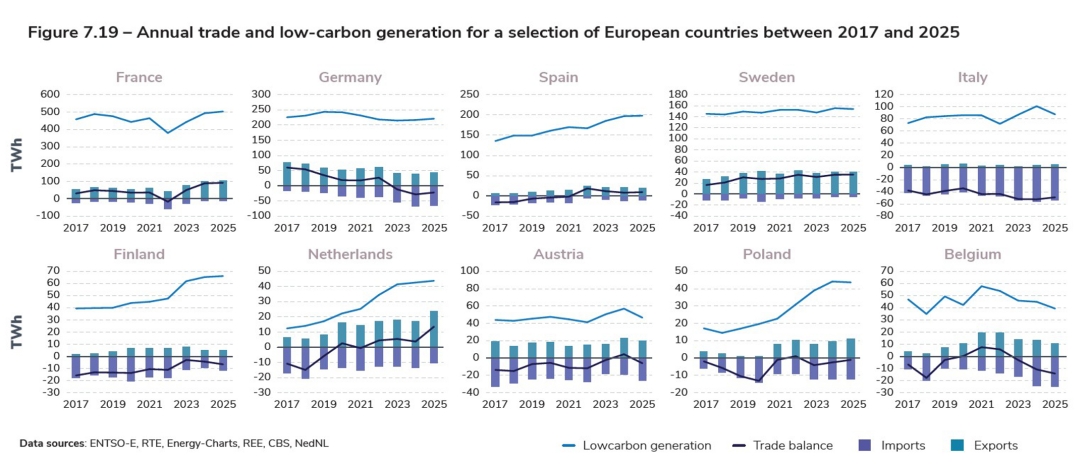
The Dutch trade balance has been rising almost continuously since it became a net exporter in 2020. It was also an exporter every month of the year for the first time in 2025, having been a net importer every month in 2018. Though its annual balance of trade with Norway remains in deficit, the balance with Germany and Belgium has changed the most, with both countries exporting on a monthly basis for the first time in 2025. In total, around 60% of Dutch imports and exports in 2025 consisted of flows passing through the country, with the remaining 40% being exports of power generated in the Netherlands or imports for domestic consumption. As a result of the way the European electricity market works, the Netherlands imports Norwegian hydroelectricity continuously, except from June to September, when it exports its solar output in the middle of the day. It also exports Norwegian hydroelectricity and its own solar power to Belgium and Germany.
Germany's trade balance was negative in 2025, as in the two previous years, whereas it was a net exporter until 2022 and even Europe's leading exporter in 2018. The shifts in Germany's trade balance are closely linked to wind generation, in terms of both daily and monthly variability and annual trends, and to the phase-out of nuclear power, which has had a marked effect on the overall direction of trade in recent years. Germany closed its last three nuclear reactors in 2023; nuclear accounted for around 24% of its electricity mix in 2010 and 12% in 2019. Since 2023, the abundance of low-carbon, low-cost generation in neighbouring countries (French nuclear, Nordic wind and hydro, Dutch solar) has enabled Germany to limit the use of its more expensive and carbon-intensive fossil-fired fleet, relying instead on imports. On a smaller scale, trade between Germany and neighbouring countries is influenced by solar and wind generation. In 2025, Germany was generally a net exporter during hours of high solar generation, in the middle of the day in spring and summer, as well as on certain nights in January and October, when wind generation was very high. Conversely, the country imported the most during the mornings and evenings in the summer months. Midday exports in July were lower than in the other months between April and September due to particularly low solar generation for the period: though this was 30% higher on average in 2025 for each month compared to the same months in 2024, generation was 8% lower in July 2025 than in July 2024 due to unfavourable sunshine conditions24.

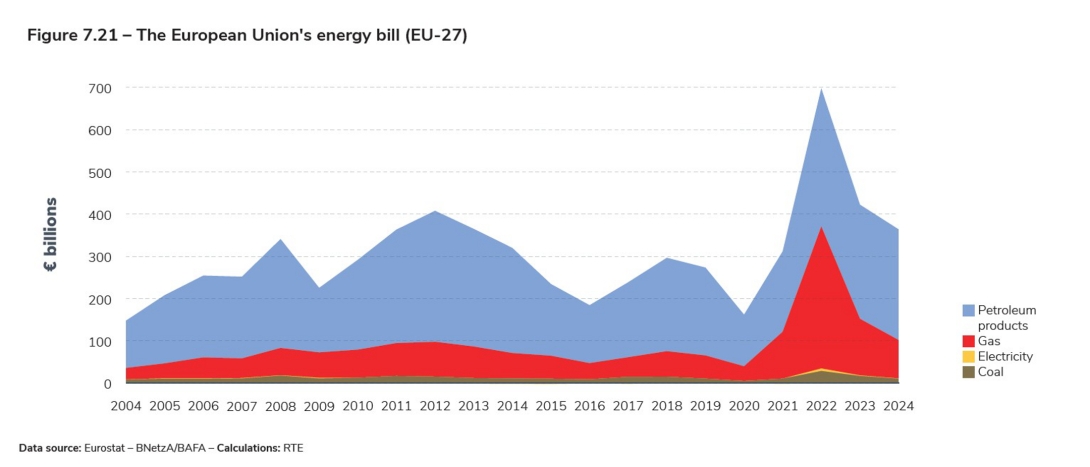
The European Union relies heavily on fossil fuel imports for its energy supply
As the European Union produces very little oil and gas, it is heavily dependent on imports for its energy supplies. In 2024, the European Union's imports of oil products, gas, coal and electricity amounted to €360 billion25, or around 15% of the EU's total imports of goods. Imports reached almost €700 billion in 2022, at the height of the triple energy crisis (high fuel prices, low availability of French nuclear generation, decline in hydropower generation) affecting electricity prices in Europe. Although imports followed a downward trend in 2024 compared with the previous two years, they remained higher than at almost any time between 2004 and 2021, a sign of Europe's marked dependence on its global partners.
Europe was dependent on fossil fuels for 27% of its electricity generation in 2024. This figure has been falling for several years (41% in 2015) thanks to the gradual decarbonisation of Europe's energy mix. As fossil fuels become electrified, this can provide leverage for decarbonising the economy as a whole, reducing both greenhouse gases and Europe's energy bill.
In an increasingly uncertain geopolitical context, the electrification of energy uses also represents a strategic opportunity to reduce dependence on non-European countries for critical supplies such as energy, where the repercussions of shocks can be massive, as the effects of Russia's invasion of Ukraine on gas prices have shown. Non-European countries currently comprise the majority of the European Union's main suppliers, which represents a risk factor in the current context. In 2024, the main gas exporters to the European Union by value were Norway (27% of imported gas), Algeria (18%), the United States (17%) and Russia (17%); the main oil exporters were the United States (16% of imported oil products by value), Norway (13%) and Kazakhstan (12%).
Focus: Information on the data used in this chapter
The European data used in this chapter is all publicly accessible. Among the multitude of sources available, RTE strives to select the most reliable and up-to-date at the time of writing. This data is subject to subsequent corrections and updates and may therefore differ from the data available at the time of publication. The sources consulted were: ENTSO-E, Eurostat, Energy-Charts, Red Electrica de España (REE), Terna, National Grid, Nationaal Energie Dashboard (NedNL), the Dutch national statistical institutes (Centraal Bureau voor de Statistiek (CBS), Destatis, Tilastokeskus, Statistikbanken, INE, Istat), the European Centre for Medium-Range Weather Forecasts (ECMWF ERA 5), the German energy regulator (BNetzA) and the German Federal Office for Economic Affairs and Export Control (BAFA).
23
In particular, some of the flows that France exports to Switzerland are re-exported to Italy (see the section on tracing trade at European level in the Trading chapter)
24
Source: ECMWF ERA 5
25
RTE estimate based on data from Eurostat and, for Germany, the energy regulator (BNetzA) and the German Federal Office for Economic Affairs and Export Control (BAFA)