BE 2025 - Prix [EN]
Sections
Section externalisée
Menu tertiaire
Paragraphes de la section
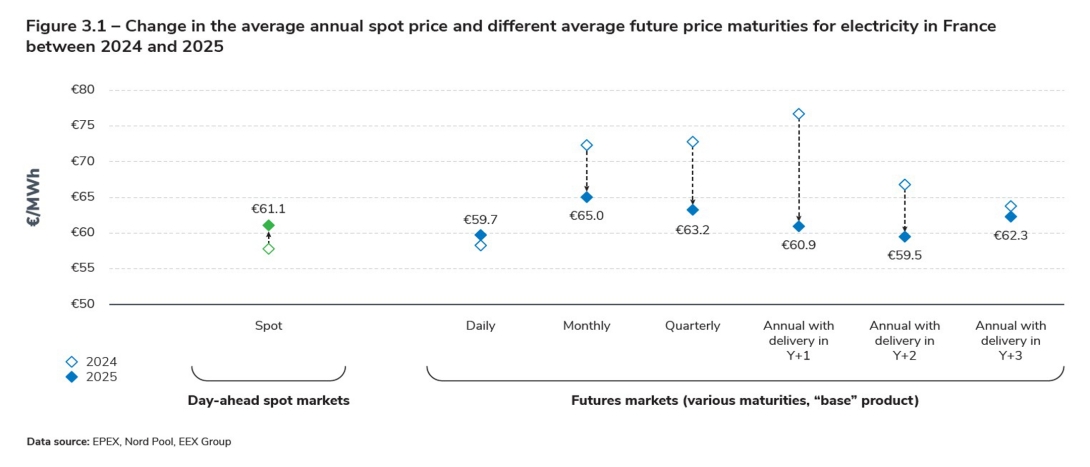
Spot electricity prices remained relatively stable in 2025, while futures prices fell and are now much lower in France than in most neighbouring countries
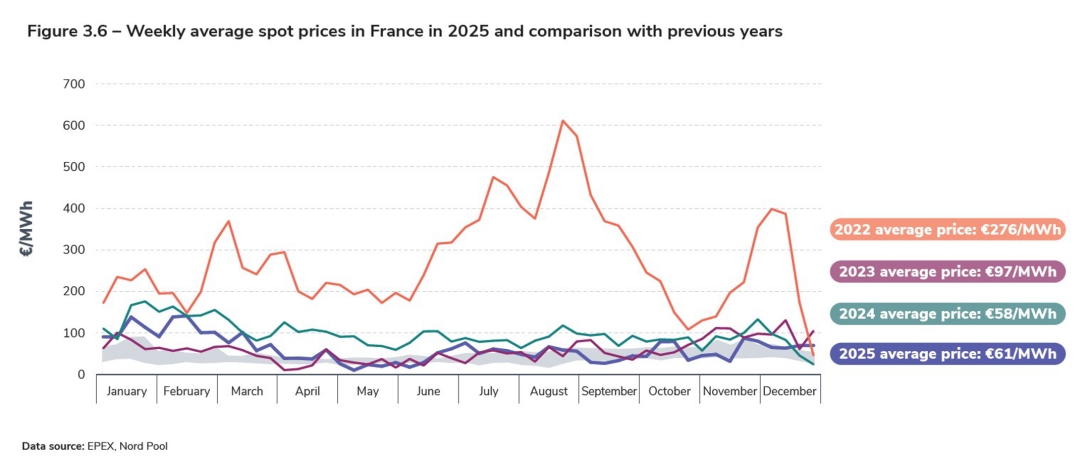
After two consecutive years of decline, the average annual spot price of electricity in France remained relatively stable in 2025 compared with the previous year, reaching €61/MWh compared with €58/MWh in 2024. This level is higher than the prices seen before 2020 (for example, the price was €39.4/MWh in 2019), but is still much lower than the prices reached between 2021 and 2023, at the height of the energy crisis (€275.9/MWh on average in 2022). In addition, spot prices have been increasingly volatile in recent years, which is reflected in the distortion of the average hourly price curve. On one hand, the morning and evening price peaks are now higher – mainly as a result of the higher price of gas (used by the power plants called on during peak periods) compared with the pre-pandemic period; on the other hand, the mid-day plateau has become a trough, as a result of lower consumption levels combined with the growth of solar generation in France and Europe.
France remained in a situation of abundant low-carbon generation, while fossil fuel prices rose slightly
The relative stability of spot prices reflects the stability of both gross electricity consumption and low-carbon generation compared with the previous year. As a result, the power system was still characterised by abundant low-carbon generation, as in 2024. This situation of “overcapacity” is likely to last for several years (see the analyses in the 2025 Generation Adequacy Report).
French gas-fired electricity generation fell by around 6%, and particularly generation by combustion turbines, which is more expensive than combined-cycle gas turbines (see Generation chapter). The price of gas rose by an annual average of around 5% compared with the previous year, reaching €35.8/MWh compared with €34.1/MWh in 2024. The gas price was at its highest in the first two months of the year (daily average of €40/MWh to €60/MWh between January and April), before following a downward trend to a low of €25.2/MWh at the end of November, one of the lowest levels in recent years.
It is also highly sensitive to the geopolitical context, which can lead to occasional price peaks. There were two of these in 2025: the first at the end of February 2025, when Russian gas transit through Ukraine was halted, and the second in June 2025, during the flash conflict between Israel and Iran. In addition, total French gas consumption1 remained stable compared with the previous year and was still around 25% lower than pre-crisis (the voluntary target for a reduction in gas consumption set by the EU at the time of the energy crisis was 15% year-on-year2). French stocks remained within the historical range for most of the year, except in January and February, when a cold snap accelerated their use. However, the regulatory storage threshold (90%) was reached at the end of August, in line with the previous year.
The cost of CO2 quotas, an element in the variable costs of generation by fossil-fired power stations, rose from an average of €66.4/t in 20243 to €74.4/t in 2025.
Overall, the rise in gas prices and CO2 quotas had an influence on spot prices when they were set by gasfired generation units, particularly at the beginning of the year; their influence on futures prices remained limited.
1
Data source: NaTran, RTE, Teréga – ODRE, Consommation quotidienne brute, November 2025
2
Toute l’Europe, REPowerEU : comment l’Union européenne veut sortir de sa dépendance aux énergies fossiles russes, December 2025
3
This is the average price for delivery in December, which is used as a reference for the quota price.
Section externalisée
Menu tertiaire
Paragraphes de la section
Futures prices continued the decline that began in mid-2023 after the energy crisis
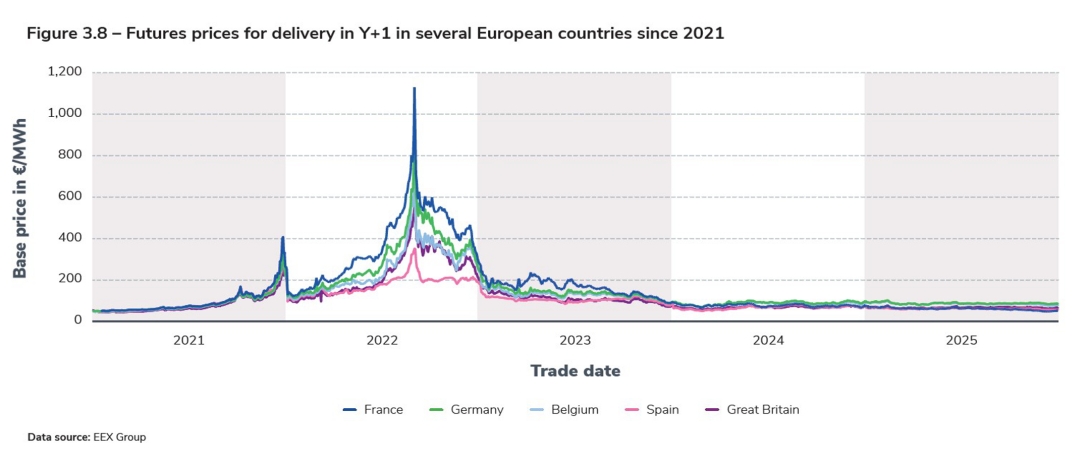
Prices for annual futures products traded in 2025 in France fell overall in comparison with the past. The price for delivery the following year dropped from €77/MWh in 2024 to €61/MWh in 2025 as an annual average. It trended downwards over the year and even broke through the €50/MWh barrier at the end of the year, something that had not happened since 2020.
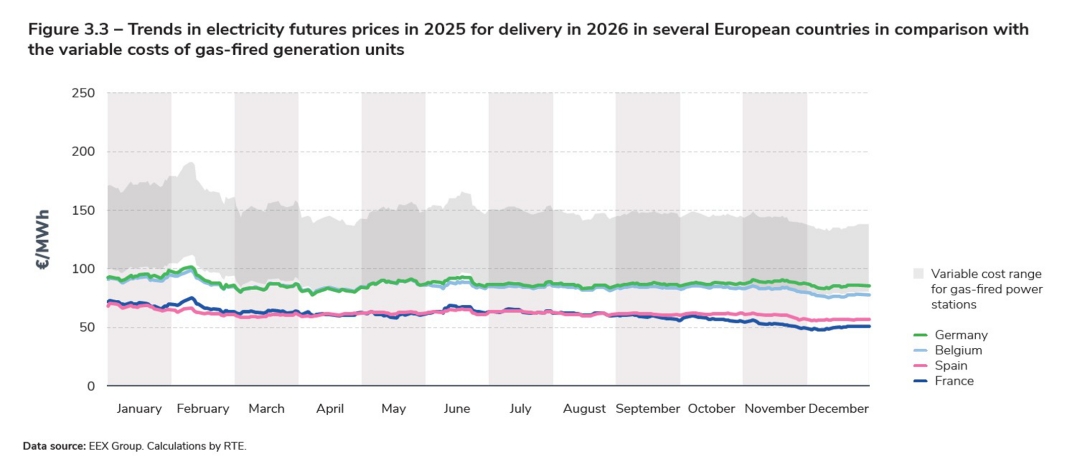
One notable difference between these two years concerns the relationship between futures prices for gas and electricity for delivery the following year. Between 2019 and mid-2024, the future price of electricity was within the range of variable costs for gas-fired power stations (dependent on gas prices, CO2 quotas and power station yields). Since the second half of 2024, annual futures prices in France have been persistently below the variable cost range for thermal power stations. They also fell below Spanish futures prices in the autumn (on average over the year, the difference was around €1/MWh in France’s favour). This is a sign that players expect prices in both countries to be often set by low-carbon generation, which is abundant in both generation mixes. In particular, prices in the two countries were several tens of euros lower than futures prices in Germany and Belgium. The latter are closer to the generation costs of fossil-fired power stations, while remaining at the lower end of the range.
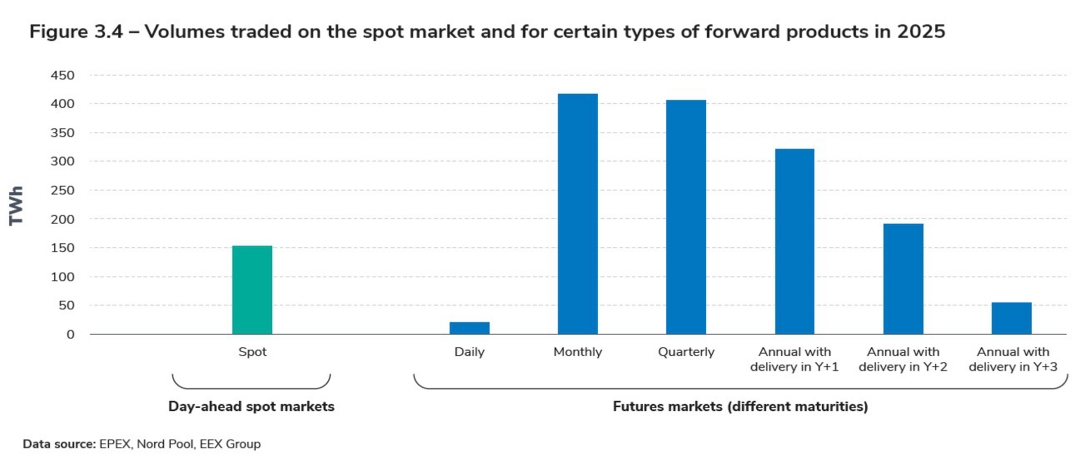
Futures products account for the largest volume of electricity traded on the markets
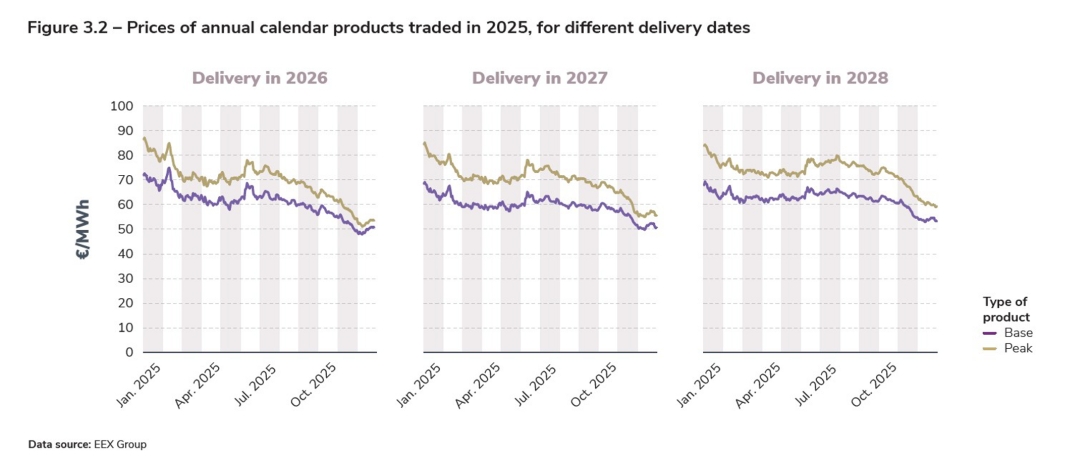
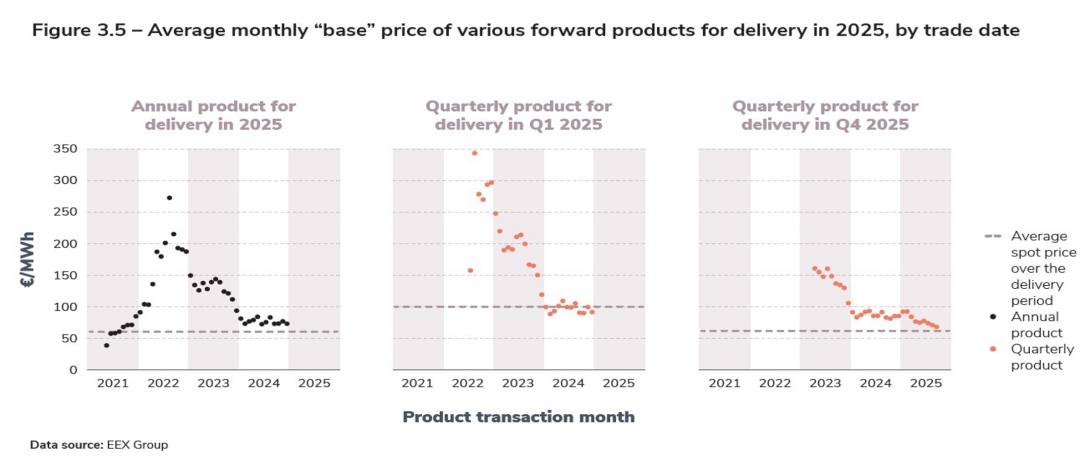
Futures markets allow players to exchange electricity traded at various times before the moment of delivery, up to several years in advance. The products traded are generally of two types: base products, which correspond to a power band over 24 hours, every day, and peak products, which correspond to a power band during working days and only over the 8 am–8 pm window (when consumption is historically generally higher than at night). These products can cover several time scales. For example, the annual base product is a power band covering a whole year while the quarterly peak product covers the 8am–8 pm slots for the working days of the quarter in question.
Futures markets enable buyers and sellers to control some of the financial risk: in a theoretical situation where players traded only on the day-ahead market, they would be totally exposed to variations in the spot price, which is increasingly volatile (see the analysis of spot prices below). By carrying out a transaction several months or years in advance of the delivery date, players (energy producers, consumers who buy directly from the markets, traders, suppliers) can secure part of their supply or sales at a price negotiated in advance. Obviously, the further in advance of the delivery date the transaction takes place, the greater the uncertainty. For example, the prices of quarterly and annual products traded on the futures markets in 2022 and 2023 for deliveryin2025weresignificantlyhigherthan the prices resulting from auctions on the dayahead spot markets in 2025, because some of these products were traded during the energy crisisof2022–2023andincludedadisproportionate risk premium (see the 2022 Electricity Review). The trade-off between different market maturities depends on each player's strategy and aversion to risk, and generally results in a mix of different maturities.
Futures products traded in 2025 represented 1,530 TWh4, compared with 1,266 TWh the previous year. Monthly, quarterly and annual products for delivery over the following two years make up the vast majority of the volume traded, accounting for more than 1,300 TWh in 2025. In fact, the increase in the volume of these products, particularly monthly and annual products, accounts for almost all the change in volumes between 2024 and 2025: around 240 TWh more than the previous year (the volume remained stable for quarterly products). The increase in volumes traded on futures markets in 2025 is partly due to the upcoming expiry on 31 December 2025 of the ARENH scheme5, which allowed alternative suppliers (excluding EDF) to purchase up to 100 TWh of electricity produced by EDF's legacy nuclear power plants at a regulated price (€42/MWh). This was the second year in which the 1,000 TWh mark was exceeded. By comparison, the volume traded on the dayahead spot market was around 150 TWh in 2025, a level comparable to the previous year, but higher than in 2023 (122 TWh). Due to the scale of the associated volumes in terms of supplies for suppliers and consumers, Futuresproducts are a decisive element in the pricing structure and thus in the bills paid by end consumers. This is true for major consumers, who can buy large volumes of electricity on the futures markets, but also for smaller consumers, since these prices are used in the calculation of the “supply” component of the TRVE regulated tariff. By extension, futures prices play an important role in setting prices for all residential consumers, since the TRVEs constitute a benchmark for the various market players.
4
EEX data totalling the volumes traded on the market and OTC - EEX, Annual volumes 2025, 13 September 2026
5
« Liquidity on forward markets up to year Y+4 significantly increased with the end of the regulated access to historic nuclear electricity (ARENH) as of January 1, 2026. » – CRE, La surveillance et le fonctionnement des marchés de gros de l’électricité et du gaz naturel en 2024, July 2025
Section externalisée
Menu tertiaire
Paragraphes de la section
Spot prices were relatively stable on average compared with the previous year, with wide variations over the year
As a result of stable consumption and low-carbon generation, the average annual spot price remained relatively stable (+€2/MWh) compared with the previous year, reaching €61.1/MWh in 2025. This stabilisation follows two years of substantial falls, driven by the recovery in French nuclear output and the drop in gas prices after the peak of the energy crisis in 2022–2023. The electricity spot price was still above the levels seen from 2002 to 2020 (€41.6/MWh on average6), but below the 2008 level (€69.2/MWh), which was affected by particularly high oil prices in the first half of the year.
The year 2025 was marked by significant variations in spot prices from month to month, with much higher prices at the start of the year. The highest monthly average price (€122.7/MWh in February) was more than six times higher than the lowest monthly price (€19.4/MWh in May). For comparison, the highest monthly price was around 2.2 times higher than the lowest before the pandemic (on average between 2002 and 2020). The 2025 ratio is the highest, ahead of the ratio in 2022, in the midst of the energy crisis (around 5.6).
The highest monthly spot prices were recorded in January and February, when the average monthly spot price exceeded €100/MWh7 (€102.3/MWh in January and €122.7/MWh in February). This high price during the first two months of the year was due to low temperatures for the season, which led to high electricity consumption (a total of 3.1 TWh more than in January and February 2024), high gas prices in response to the stoppage of Russian gas flows transiting through Ukraine (+€22.4/MWh compared with the same months in 2024, an increase of almost 85%) and limited wind generation for a month of February (2.1 TWh lower in February 2025 than in February 2024).
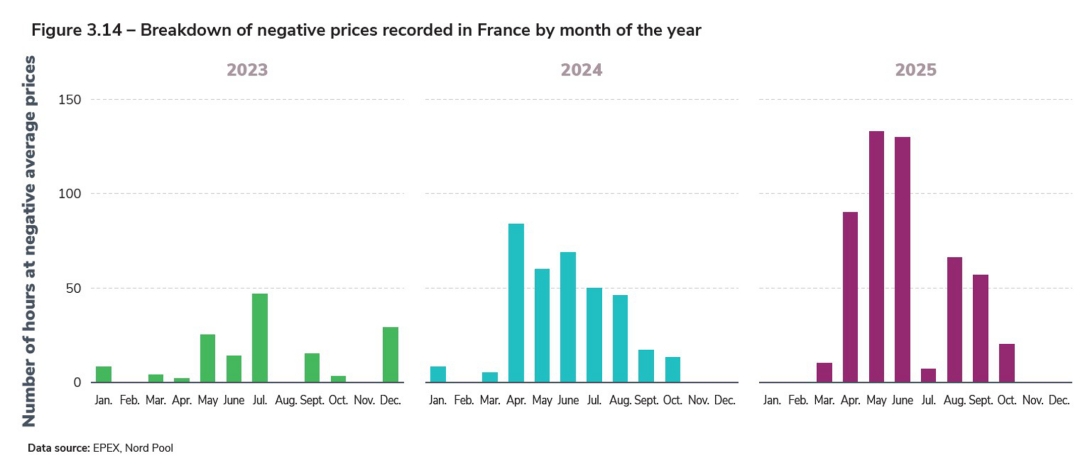
The monthly spot price fell below the €20/ MWh threshold during May 2025 (€19.4/MWh), a threshold that had not been crossed since May 2020 under the effects of the pandemic. This fall in prices in May 2025 was driven by strong solar output (3.5 TWh, +0.8 TWh compared with May 2024) and wind generation (3.5 TWh, +0.9 TWh), with consumption similar to the same month the previous year (+1 TWh). This led to negative prices on multiple occasions, with a record number of monthly occurrences (133), closely followed by June (130).
6
In current values.
7
This price level has been the pattern for the winter months since 2021, but before that the highest average monthly price seen in a January or February was €82.3/MWh in February 2012, the month that saw the historic maximum consumption in France.
Section externalisée
Menu tertiaire
Paragraphes de la section
French prices decoupled from those in all the neighbouring countries on both the spot and futures markets in 2025
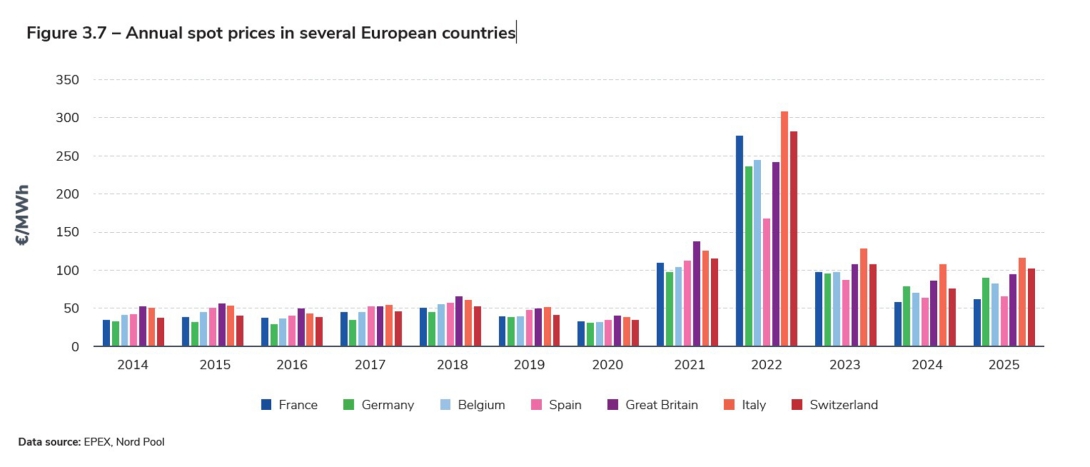
The French spot price was among the most competitive in Europe in 2025, behind the Nordic countries. It was in fourth place behind Norway, Finland and Sweden, whose electricity generation mix is almost entirely low-carbon, and was below the price in all neighbouring countries.
Prices in France have largely decoupled from those in neighbouring countries. In particular, the price differentials are now between €20 and €50/MWh for Germany, Belgium, Great Britain, Switzerland and northern Italy. The French spot price was lower than the German spot price for the second year in a row, which had not previously happened since 2011. The turnaround in the spread between the two countries can be explained structurally by changes in the German mix, with its last nuclear power station closing in 2023, but also by the recovery in the availability and output of the French nuclear fleet and by two years of unfavourable conditions for wind generation in Germany. French prices also remained below Spanish prices for the second year running, with a €4/MWh gap in France’s favour (compared with €5/MWh in 2024). On a monthly basis, the sign of the spread between France and Spain, like the balance of trade, varied throughout the year according to changes in low-carbon generation and consumption on both sides of the border.
The fact that the price differential with Spain is lower is due to the high proportion of low-carbon generation in its mix, and therefore its lower dependence on fossil fuel prices compared with France's other neighbours. Historically, French prices were lower than Spanish prices, but strong growth in renewable energy in Spain, combined with the presence of nuclear power at around 20% of the mix, has made the Spanish mix more competitive with the French mix (see also the Europe and Trading chapters).
Spot electricity prices rose more sharply in other neighbouring countries, where the influence of fossil fuel prices is higher than in France: by around ten euros for Germany, Belgium, Great Britain and Italy, and by almost thirty euros for Switzerland. .
The competitiveness of the French mix can also be seen in annual forward products for delivery the following year. Only Spain has a similar average price level, but from September onwards the French future price fell even lower than the Spanish price. This inversion between the two neighbours' futures prices marks a break with the period from the end of 2021 to mid-2024, when Spanish prices on the futures markets were more competitive than French prices.
The competitiveness of the French electricity mix reflects the abundance of low-carbon production at low variable cost in France, and constitutes a considerable asset for decarbonising the economy and accommodating new end uses (see the Electrification chapter and the 2025 Generation Adequacy Report published by RTE in the autumn).
Section externalisée
Menu tertiaire
Paragraphes de la section
The hourly price profile is gradually being distorted by solar generation
The average hourly profile of spot prices over the course of the day has shown a fairly marked change since 2023, which has already been well documented by RTE in several recent publications. Historically, the daily price profile showed a trough during the night, then a peak in the morning followed by a plateau in the middle of the day and finally another peak in the evening. There have been two main developments in recent years: on one hand, the morning and evening price peaks are now higher – mainly as a result of the higher price of gas compared with the pre-pandemic period; on the other hand, the mid-day plateau has become a trough, as a result of lower consumption levels combined with the growth of solar generation in France and Europe. This trough is even more marked at weekends, when consumption is structurally lower. With this distortion of the spot price curve, especially in spring and summer, the spot price is often lower during the day (8 am to 8 pm) than its daily average.
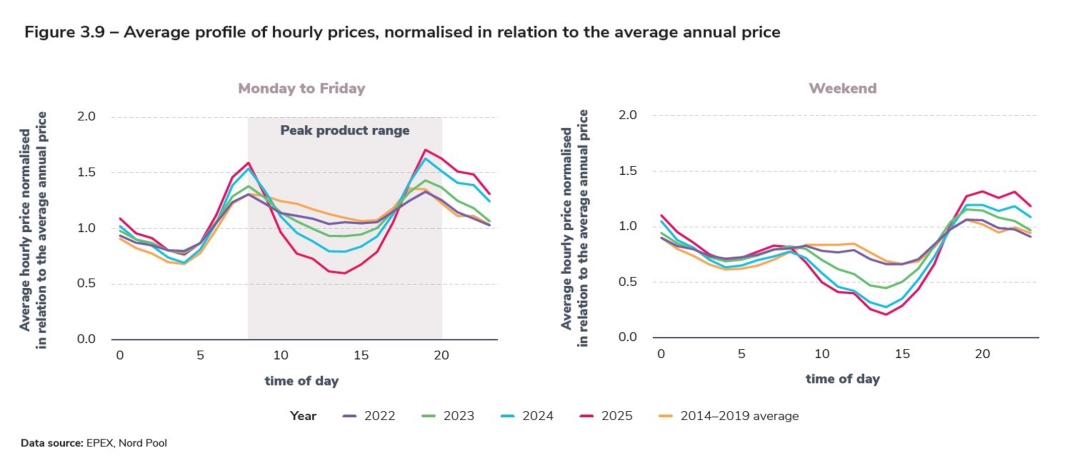
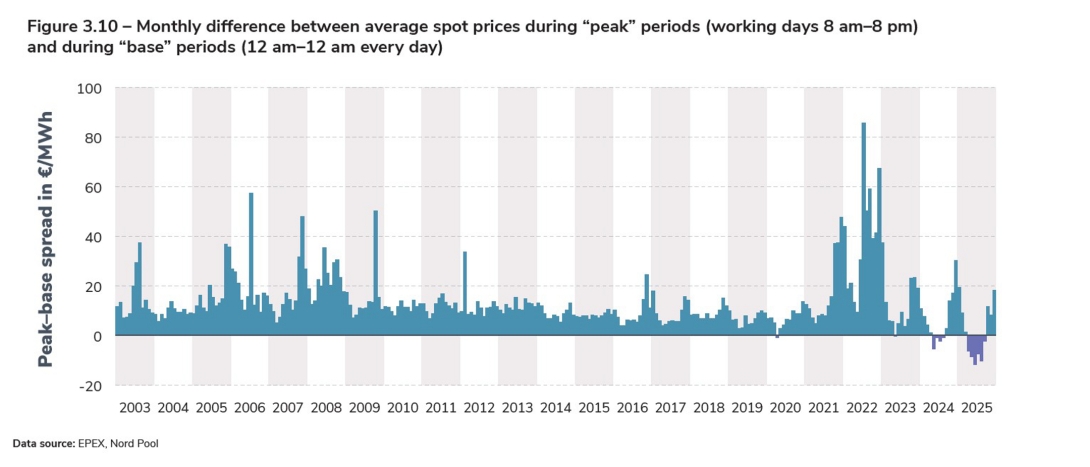
This gradual change to the spot price curve means “base” and “peak” products on the futures markets are also seeing their levels inverting relative to past trends. Between April and September 2025, the average spot price over the time steps corresponding to “base” products was higher than the price of “peak” products, which were initially intended to reflect periods of high consumption (and therefore higher prices). This inversion had already been seen between May and August 2024.
On the futures markets, the prices of monthly calendar products for delivery in July and August 2025 showed a similar inversion.
This change in the hourly profile highlights the importance of developing flexibility in the power system, in terms of both generation and consumption. In particular, shifting consumption to times of high low-carbon generation appears to be a valuable solution for optimising the balance and overall cost of the power system, limiting the modulation of renewable generation, minimising the need for thermal generation resources and, for consumers, reducing bills by optimising the positioning of their consumption during off-peak hours. In addition, regulatory changes have been introduced to encourage renewable generation to make a greater contribution to system flexibility (see Generation chapter).
The spread of batteries (with around 13 GW on the waiting list, see Generation chapter) could also provide significant flexibility. Today, batteries mainly contribute to the provision of system services. In the medium term, the prospects for these storage facilities, particularly in terms of participation in the daily and intraday wholesale markets, will depend on the dynamics of consumption and production.
Focus : Switch to 15-minute intervals
On 1 October 2025, the day-ahead spot price changed from an hourly interval to a 15-minute interval: instead of 24 hourly auctions, there are now 96 auctions (quarter-hourly delivery) that take place each day for the following day. On 1 January 2025, the interval for settling imbalances (by balance responsible parties) had already followed a similar pattern, being reduced from 30 to 15 minutes.
These regulatory changes were motivated by the desire to encourage players to ensure the balance between generation and consumption within their perimeter at shorter this balance, in order to improve the management of the supply–demand balance the day before for the following day.
Initial analyses based on the last three months of 2025 (which are by their nature partial and relate to what was still a period of adaptation) show that the spot price curve is still broadly the same shape. The main notable change is that the curve now has a “sawtooth” profile within each hour, but with less variation compared with the daily amplitudes. Variability within each hour is greatest in the morning and evening, and lowest in the middle of the day and at night.
Spot price volatility is much higher than before the crisis
In recent years, the volatility of hourly spot prices has increased significantly compared with the years before the pandemic and the energy crisis, both in terms of standard deviation (€46.4/MWh in 2025 compared with €40.1/MWh in 2024 and €14.0/MWh in 2019) and average daily amplitude8 (€89.7/MWh in 2025 compared with €76.4/MWh in 2024 and €27.2/MWh in 2019).
This increase in volatility is also clear when hourly prices are compared with historical price ranges: in 2025, hourly spot prices were above the 2014–2019 range over half the time, slightly more than in 2024 (52% compared with 48% respectively), and were below it around 25% of the time (compared with 21% in 2024).
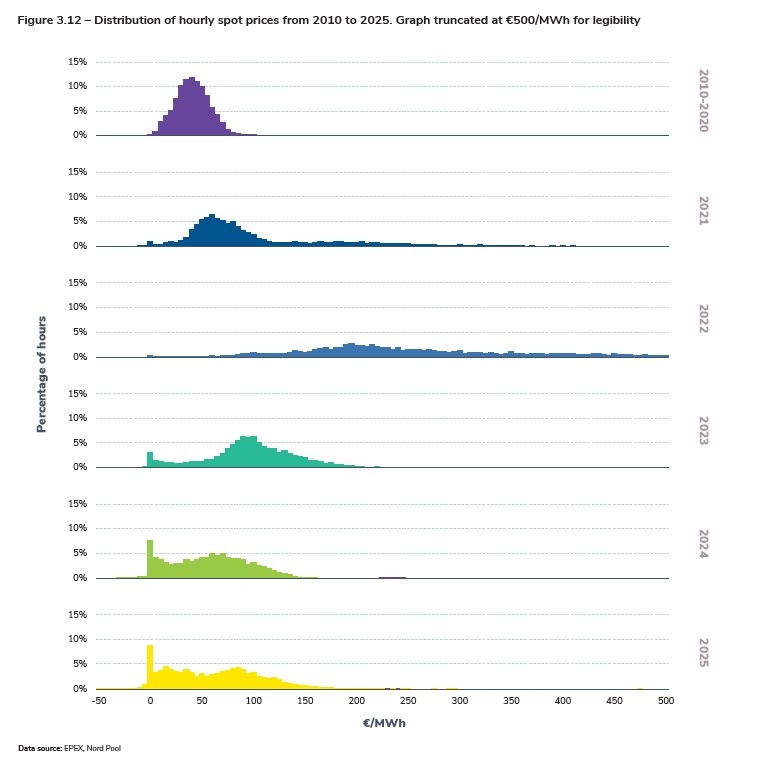
The increase in the variability of spot prices can be explained partly by the “coexistence” of very high prices and low or even negative prices within the same day. More generally, the distribution of hourly prices has changed significantly over the last four years. From 2010 to 2019, spot prices remained within a fairly narrow range. In 2020, a few lower prices appeared at the height of the pandemic, without fundamentally changing the shape of the distribution.
Since 2021, prices have been spread out over a much wider range, firstly as a result of the energy crisis, which led to a large number of high prices at the end of 2021 and during 2022, and then with the increase in the number of very low or negative prices from 2023 onwards. As a result, there have been significantly more periods of negative prices or “high” prices since 2021. While the former appear mainly when low-carbon generation is very abundant compared with consumption levels (see the following section for a detailed analysis), the latter reflect the increase in the operating costs of gas-fired power stations relative to the years from 2010 to 2020.
8
The average daily amplitude is calculated as the average difference between the maximum price and the minimum price on each day.
Section externalisée
Menu tertiaire
Paragraphes de la section
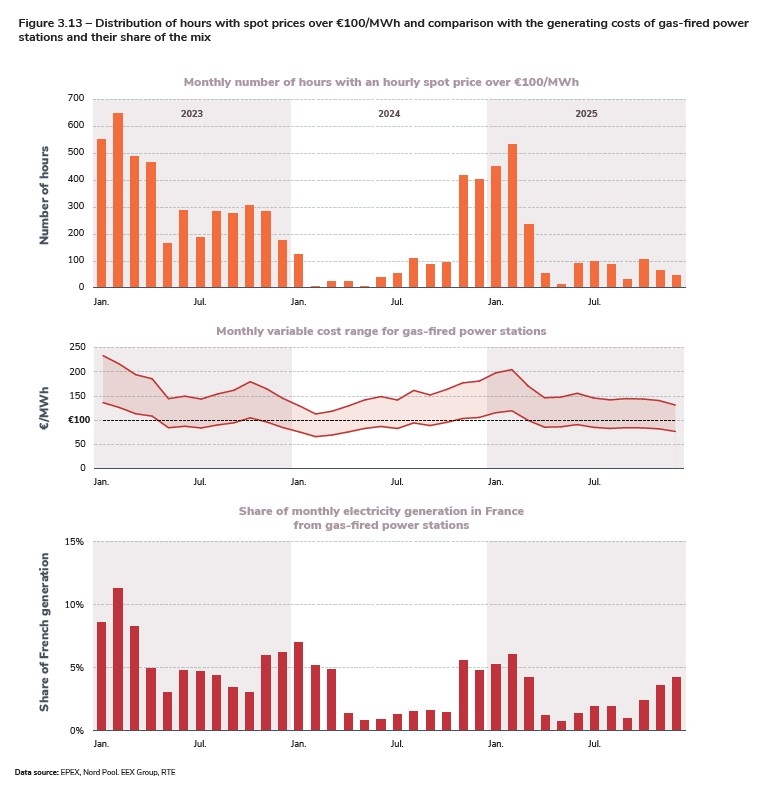
The increase in the number of high-price hours reflects the rise in variable costs for gas-fired power stations
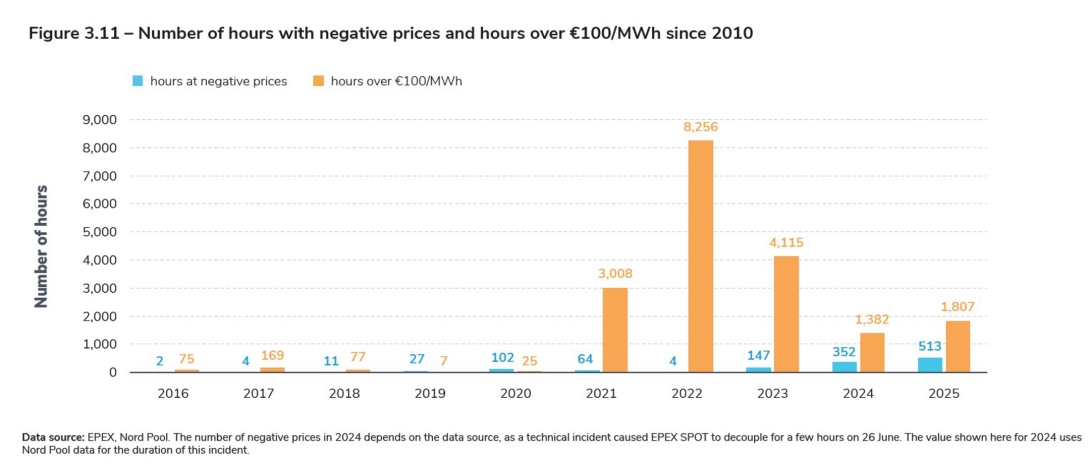
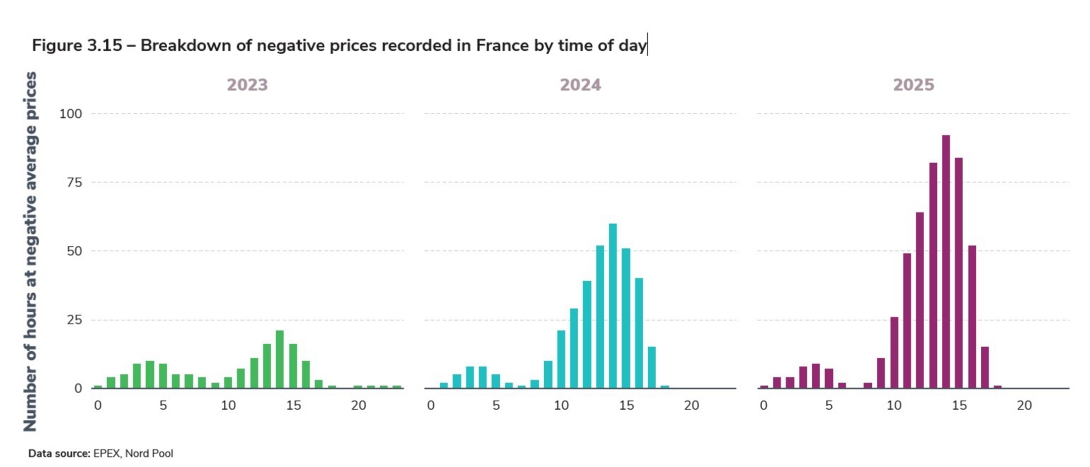
In 2025, 1,807 hours exceeded the symbolic threshold of €100/MWh, compared with 1,382 in 2024. These high-priced hours occurred mainly during the first quarter of 2025, when consumption was higher. This was when gas-fired power stations were used the most; gas prices were also relatively high at the beginning of the year, before starting to fall in the spring. In the first quarter of 2024, although gas-fired power stations were used in similar proportions to the first quarter of 2025, their operating costs were relatively lower because gas prices were at the bottom of the curve at the time, which meant that the number of hours when the price exceeded €100/MWh was lower in 2024. These high-price hours generally occur from Monday to Friday between 7 am and 10 am and then between 6 pm and 10 pm, at the opposite points of the cycle to the negative-price hours.
The number of high-price hours has been higher in recent years than in the decade from 2010 to 2020: this reflects the higher operating costs of gas-fired power stations compared with the earlier period, rather than an increase in the use of these plants. In fact, gas-fired generation in 2025 was around 16 TWh (approximately 3% of the mix), compared with an average of 28 TWh over the period from 2010 to 2020 (representing an average of 5.7% of the mix). For comparison, variable costs for gas-fired power stations ranged from €15/MWh to €100/MWh9, depending on the month, between 2011 and 2020. In 2025, these variable costs ranged from €80/MWh to €230/MWh. Gas-fired power stations in France were used almost equally in March (2.2 TWh) and November 2025 (2.1 TWh), but the price of gas was considerably higher in March (€40.7/MWh) than in November (€29.5/MWh),
which explains the significant difference in the number of hours when the price exceeded €100/MWh during these two months (236 in March compared with 63 in November). On the other hand, the proportion of the time when the hourly spot price exceeded the bottom of the range of variable costs for gas-fired generating units in France, an indicator of the proportion of the time when these generating facilities set the price, was similar for these two months (around 30% of the time). In addition, other generating resources may use the price of gas as a reference for setting their bids, particularly in the case of generating resources that depend on stocks, such as reservoir hydropower or batteries.
9
This interval concerns the variation in the average monthly variable cost, calculated on the basis of average monthly gas and CO2prices, with the assumption of an efficiency interval ranging from 35% to 60% and emissions of 0.204 tonnes of CO2 per MWh of gas consumed.
Section externalisée
Menu tertiaire
Paragraphes de la section
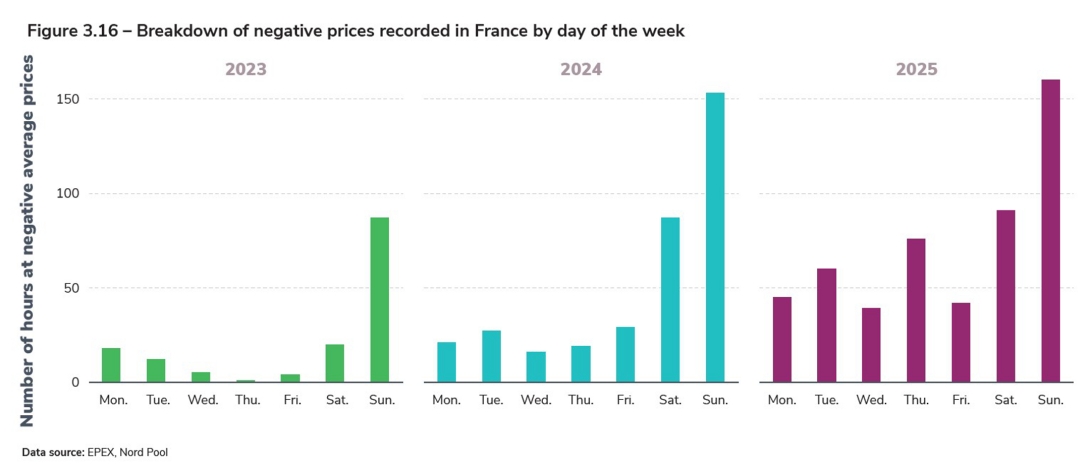
Growing incidence of negative spot prices, with negative prices appearing more frequently during the week
The hourly spot price was negative for 513 hours10 in 2025, a higher number of occurrences than the previous year (352 in 2024), representing around 6% of the time over the year. The main change concerning negative prices is that they appeared more frequently on weekdays (Monday to Friday) than in previous years: 51% of hours with negative prices were recorded on weekdays in 2025, compared with 32% in 2024 and 27% in 2023. On the other hand, in line with previous years, negative prices mainly occurred in the middle of the day between April and August, i.e. when consumption is lowest and solar output is highest. Nearly half the occurrences took few occurrences in France (only seven) and in neighplace in May (133 hours) and June (130 hours). bouring countries due to an increase in residual The month of July 2025 was an exception in terms consumption in France, Germany and Belgium.
Negative prices were less negative than in 2024
While the number of hours with negative prices rose sharply between 2024 and 2025, prices were less strongly negative on average. The average negative price was €−6.5/MWh in 2025, compared with €−10/MWh in 2024 and €−6.8/MWh in 2023. These low absolute values mean that the electricity traded on the spot market during negative-price periods represented less than 1% of the total value traded, although these periods account for around 6% of the time.
Prices between €0 and €−0.1/MWh account for over half of the occurrences of negative-price hours (55% in 2025 compared with 36% in 2024 and 54% in 2023). In other words, if the spot price had been €0.1/MWh higher over all the hours of the year, the number of negative prices would have been more than halved. Strongly negative prices were also much less frequent than in 2024, with prices below €10/MWh accounting for 14% of occurrences in 2025, compared with 31% the previous year.
The consequences of negative prices arise from the operation of the power system and require its management to be adapted
Negative prices now occur in situations where consumption is low and low-carbon generation is plentiful. During these periods, renewable energy sources that benefit from the premium scheme have an economic incentive to stop generating.
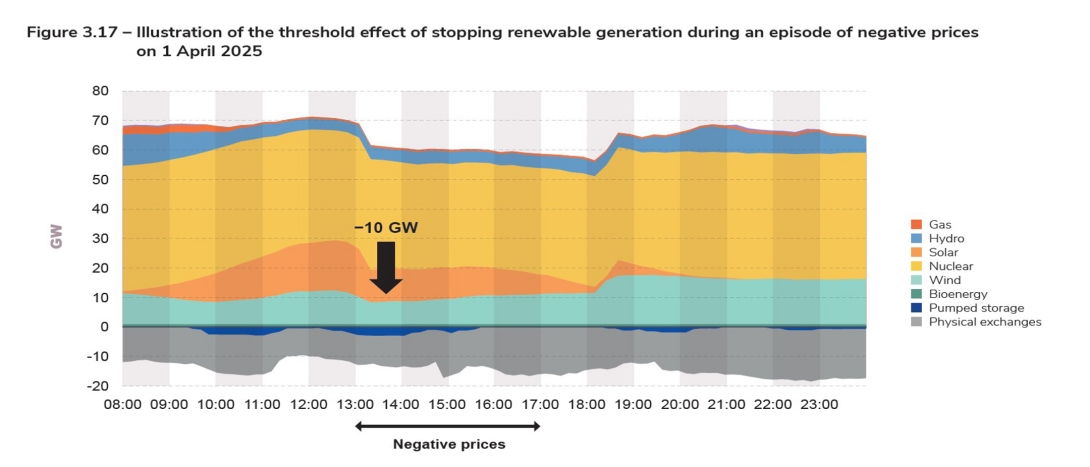
These stoppages occur simultaneously when the consumption is low and low-carbon generation is negative-price period begins, resulting in a rapid fall plentiful. During these periods, renewable energy in output whose precise scale is difficult to predict very specific operating situations. This issue requires all the more care in terms of system operation in that information on the scheduling of shutdowns and restarts is often not transmitted to RTE. To meet this challenge, the scheduling system needs to be strengthened (by making programmes more reliable and updating them frequently) to anticipate this type of stoppage, and variations in output need to be controlled to ensure market players behave in a way that is consistent with the physical needs of the grid.
Methods for ensuring the operation of the power system during these trough periods are identified and grouped together in RTE's transformation plan for power system operation. RTE has already presented them to stakeholders in a detailed consultation programme. New legislative and regulatory provisions have recently been put in place to gradually increase the contribution of renewable energy sources to downward modulation and the balancing mechanism. The operational implementation of these new provisions now needs to be completed as quickly as possible and, more generally, the scheduling and operating rules need to continue to evolve in order to guarantee the balance of the power system over the coming years.
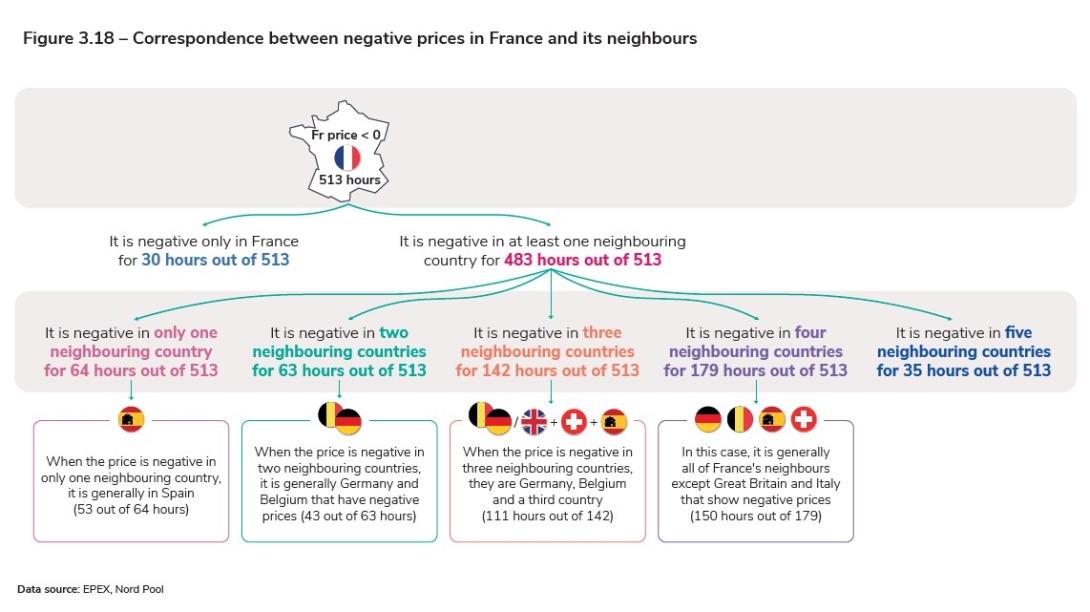
Neighbouring countries are experiencing negative price episodes in similar proportions
In France's neighbouring countries, the number of negative prices was of the same order of magnitude as in France. Germany recorded 576 hours at negative prices (457 in 2024) and Belgium 519 hours (404 in 2024). In Spain, which experienced its first negative prices in 2024, the number of negative-price hours more than doubled, rising from 247 to 556. Switzerland and Great Britain recorded 303 and 149 hours with negative average prices respectively.
These negative-price episodes generally occur at the same time as in France. As an illustration, situations where the French price is negative while all its neighbours’ prices are positive or zero account for only 30 of the 513 occurrences of negative prices in France in 2025.
In general, the technical and economic fundamentals that lead to negative prices in France also apply in neighbouring countries. Moreover, the coupling of the European markets means that prices tend to converge between neighbouring countries if trading capacity allows. During these episodes, just as when prices are positive, electricity is exported from the country where the price is lowest to the one where it is highest. This lowers the equilibrium price in the importing country.
When the French price is negative, France is a net exporter of electricity 90% of the time (460 of the 513 hours). However, it is often an importer across at least one of its borders (419 of the 460 hours), which means that in these situations, as for the rest of the year, it plays its role as an “electricity crossroads” due to its geographical location (see the Trading chapter) by importing electricity across one of its borders and re-exporting it across another. This situation, combined with the complexity of determining the marginal generation source (in France or abroad) setting the price, makes it difficult to identify unambiguously the origin of a negative price when electricity is being traded across borders.
It is important to note that a small increase in residual consumption can significantly reduce the number of instances of negative prices recorded, as was the case in July 2025. Once again, France has a large amount of energy generated from competitive low-carbon sources, which is an asset in terms of the electrification of energy uses currently powered by fossil fuels.
Focus: Why do negative prices happen?
Negative prices generally occur during times of low consumption combined with high renewable energy generation. During these periods, offers from producers can contribute to the formation of negative prices. Depending on the type of support mechanism involved, renewable energy producers may offer their output at a negative price in order to be selected. Dispatchable generating units may also formulate offers with negative prices, either because they prefer not to shut down their unit in order to save the associated technical costs, or because their operational planning requires them to respect a certain minimum level of production.
In addition, certain complex offers can also contribute to the appearance of negative prices. For example, a “block” offer is an offer to sell over several time intervals at a given price. If it is accepted, the seller is selected for the duration of the block, which reduces the volume remaining to be satisfied by shorter-interval bids11. In certain configurations, this mechanism can facilitate the appearance of negative price hours.
Negative prices are not in themselves an anomaly in the functioning of the market. In theory, the negative price is a legitimate economic signal, encouraging consumers to increase their consumption during periods of high renewable production, and producers with controllable units to lower their production levels. In fact, however, as only a small part of electricity consumption at a given time is covered by volumes traded at the spot price (or whose price is indexed to it), the incentive effect of this signal on the level of consumption is reduced.
In addition, a large part of renewable production is also not exposed to market prices, having direct power purchase agreements through the feed-in tariff mechanism. The negative price does not then act as an incentive to reduce this production. On the other hand, facilities on the premium scheme have an incentive not to produce if prices are negative. The mechanism does not provide for any remuneration for generation during these episodes, but it provides compensation if the total number of hours the facility is shut down over the year exceeds a threshold defined for each generation source.
In a power system where the share of renewable energy is growing, negative prices are likely to occur more frequently, particularly if the electrification of energy uses is delayed and electricity consumption is slow to rise. The resources for dealing with these situations are clear:
•the flexibility of the generating fleet: the manoeuvrability of France’s nuclear fleet is an essential source of flexibility;
• The development of support mechanisms for renewable energy: the premium scheme provides support for generating sources while encouraging modulation;
• The development of demand flexibility and storage. Generally speaking, certain uses of electricity (such as recharging electric vehicles or water heaters) could take place during the periods of the day most likely to experience negative prices, with no effect on user comfort and extremely competitive economic conditions for the consumer.
In this context, it is also worth recalling the usefulness of cross-border trade and the integration of European markets: the operation of the European electricity market enables optimum use to be made of the generating capacity available, within the limits of the trade capacities between the various countries.
Trade makes it possible to take advantage of the variability of production and consumption profiles in different market areas, while minimising the cost of production on a European scale. In a purely theoretical situation in which there are no limits on trade in Europe, the price would be the same everywhere (negative or not), and all generation across the continent could be matched with all consumption in an optimised way.
In this hypothetical situation, negative prices would only be possible if the non-dispatchable renewable output of the whole of Europe were greater than the whole of Europe’s consumption at a given moment. But total wind and solar power output is nowhere near the level of European consumption on an hourby-hour basis. Over the last four years, as negative prices have multiplied, the average coverage rate has risen from 21% to 27%, andthemaximumratefrom50%to64%.This is purely theoretical, but it shows the advantages, in terms of managing the power system and minimising generating costs, of being able to “pool” generation and consumption across different countries via an interconnected power system and an integrated European electricity market.
10
After the switch to the 15-minute interval, an hour is considered to have a negative price if the average of the prices over the hour is negative, to maintain comparability with past records.
11
This is a simplified explanation for information purposes. In practice, prices result from a process of joint optimisation over all the time intervals of the day, carried out by the market coupling algorithm.